What I gathered from feedback here over time is that the best way to improve render performance in my project is to use more instances and less draw calls, materials and textures.
I finally managed to figure out how to combine instances, sprite maps and alpha blending in such a way that I could control the render order (spoiler alert: it involves overwriting the renderSorted function).
I was super excited to try this and managed to get the number of draw calls in a control scene down from 202 to 82!! The number of materials from 266 to 157 and textures from 162 to 132.
I also am super excited about the possible performance gains of webgpu.
But the results are extremely disappointing so far, because the performance (see absolute fps) went down for the instances and webgpu takes it down more (my hopes are still up though, so please help me out ).
(left: before, middle: after, right: after + webgpu)
It will be a bit slower without any optims due to all the involved caching necessary to handle all the various weirdness possible in WebGL @Evgeni_Popov did an amazing job of bringing in a lot of toys to make it faster.
absolute FPS is only the CPU side of the equation and yes renderSorted will be slow as it will sort an array of meshes on every frame which is why it is not done by default.
That said on Mobile are you bound on CPU or GPU if it is CPU, optimizing for might have a counter intuitive result.
What I do not understand is why your GPU time is going up. Are you using more complex shaders or a lot of transparency ? cause overdraw will have a negative impact on some mobile GPUs
I do think CPU is the bottleneck, but I’m not exactly sure how to confirm this.
I do use a lot of transparency (drop shadows, the textbox background, all the text, some icons, the black overlays, shading on top of the cards, etc…) but this has not changed, only before they were all separate materials/draw calls).
I think I use one custom shader on the green background (wasn’t there before).
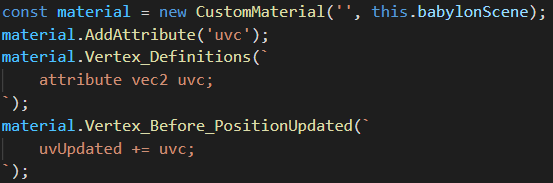
I also use this trick I scouted somewhere here to share material amongst the big numbers for example:
Regarding the GPU frame time, unfortunately I noticed (when doing some WebGL / WebGPU comparisons) it can largely vary from one run to another for the same PG…
You should run your tests several times (for exactly the same scene - which is not the case in your screenshot as the number of faces/vertices/active meshes is not the same) and see if you still experience the same gaps.
Also, the durations are very low (2ms - 2.5ms for the frame time) and even a 0.1ms difference will make quite a difference on the absolute fps: 2.13ms corresponds to 470 absolute fps whereas 2.03ms is 492 fps. So, you should be sure to make some averages before drawing conclusion.
Using the performance tab of Chrome may provide better measuring for the CPU/GPU threads, as you can let the snapshot run for 5/10s (or more). But be careful on what is currently running on your computer, it could kill your recording (for eg, if your anti-virus decides to kick just at the wrong time…). You should also perform several recordings and make either an average or throw out the fastest/slowest ones.
Clearly, the scene with the lower number of draw calls should run at least at the same speed, if not faster. But the absolute fps is based on the CPU time, so you should really see about the same perf in both cases (if you test the same scene, meaning active meshes / indices / faces is the same) as most of the time is spent in meshes selection. You normally should not see greater value for GPU frame time, but as explained above this counter is not always reliable (not Babylon.js fault).
As @sebavan said, however, if you are now sorting the meshes each frame and you didn’t do it in the first case then it’s possible to see slower perf becase you are CPU bound and sorting in javascript clearly takes a little time (at least more than not sorting at all!).
the sorting already happened before, except there was way less batching, so there even was more to be sorted.
I ran the tests multiple times over long times (10-60s) and performance clearly didn’t improve (I noticed it got a little worse while playing the game even).
But even if the test is 10% wrong, the expected result of having 60% less draw calls should still be improved performance as far as I understand (I would expect something like 30% less render time). This means there is something I don’t understand. Something is slowing it down more than is speeding it up, I’m sure of it. Like I said, there are more meshes now, because of the inactive meshes that the instances are base on. But I don’t think this fully explains the slowing down.
a reproduction is useful for isolation or if you want to test something, but this concerns the whole scene, so isolation is not the point I suppose.
I can give you the before and after in production.
Or maybe you can tell me what you want to test and I can do it?
update: I got the evaluateActiveMeshes down to 0.00ms on both before and after. As expected it just ups the FPS for both, so the problem has not to do with that.
You need to look into the bottom up of your perf profile and try to narrow the culprit. You can also add more logs and so on to measure timing of some specific functions and such.
you’re right… the FPS fluctuates a lot and I think the GPU frame time might also be an anomaly, I don’t see it anymore.
I got the evaluateActiveMeshes down to 0.00ms on both before and after. As expected it just ups the FPS for both, so the problem has not to do with that.
I annotated the perf image with what went up or was new.
Not sure why renderForCamera is up there, it doesn’t seem to do much in its ‘self’.
I also traced all my changes and it doesn’t look like anything impactful apart from the new instancing with the added color and uv instance buffers.
It just seems like all the gains from the lessened draw calls is lost by the added overhead of the buffers?
if I use the uv trick I have 82 draw calls and get 540 FPS (like above)
if I disable the uv buffers I get 82 draw calls and 640 FPS (this looks bad of course, so just for testing)
if I don’t use the trick → less shared instances → 91 draw calls and 540 FPS
So yeah, it costs about the same as it gets me.
Does anyone have an idea on how to get the best of both worlds? (note that I don’t need to set the buffers after setting them once)
edit: upon further isolated testing the uv trick seems to be pretty performant, so I’m still not quite sure what is going on.
this is the isolated test: only 2 draw calls/materials and disabling the uv buffers is not much of a gain.
Any ideas on what or how to test more effectively is appreciated.