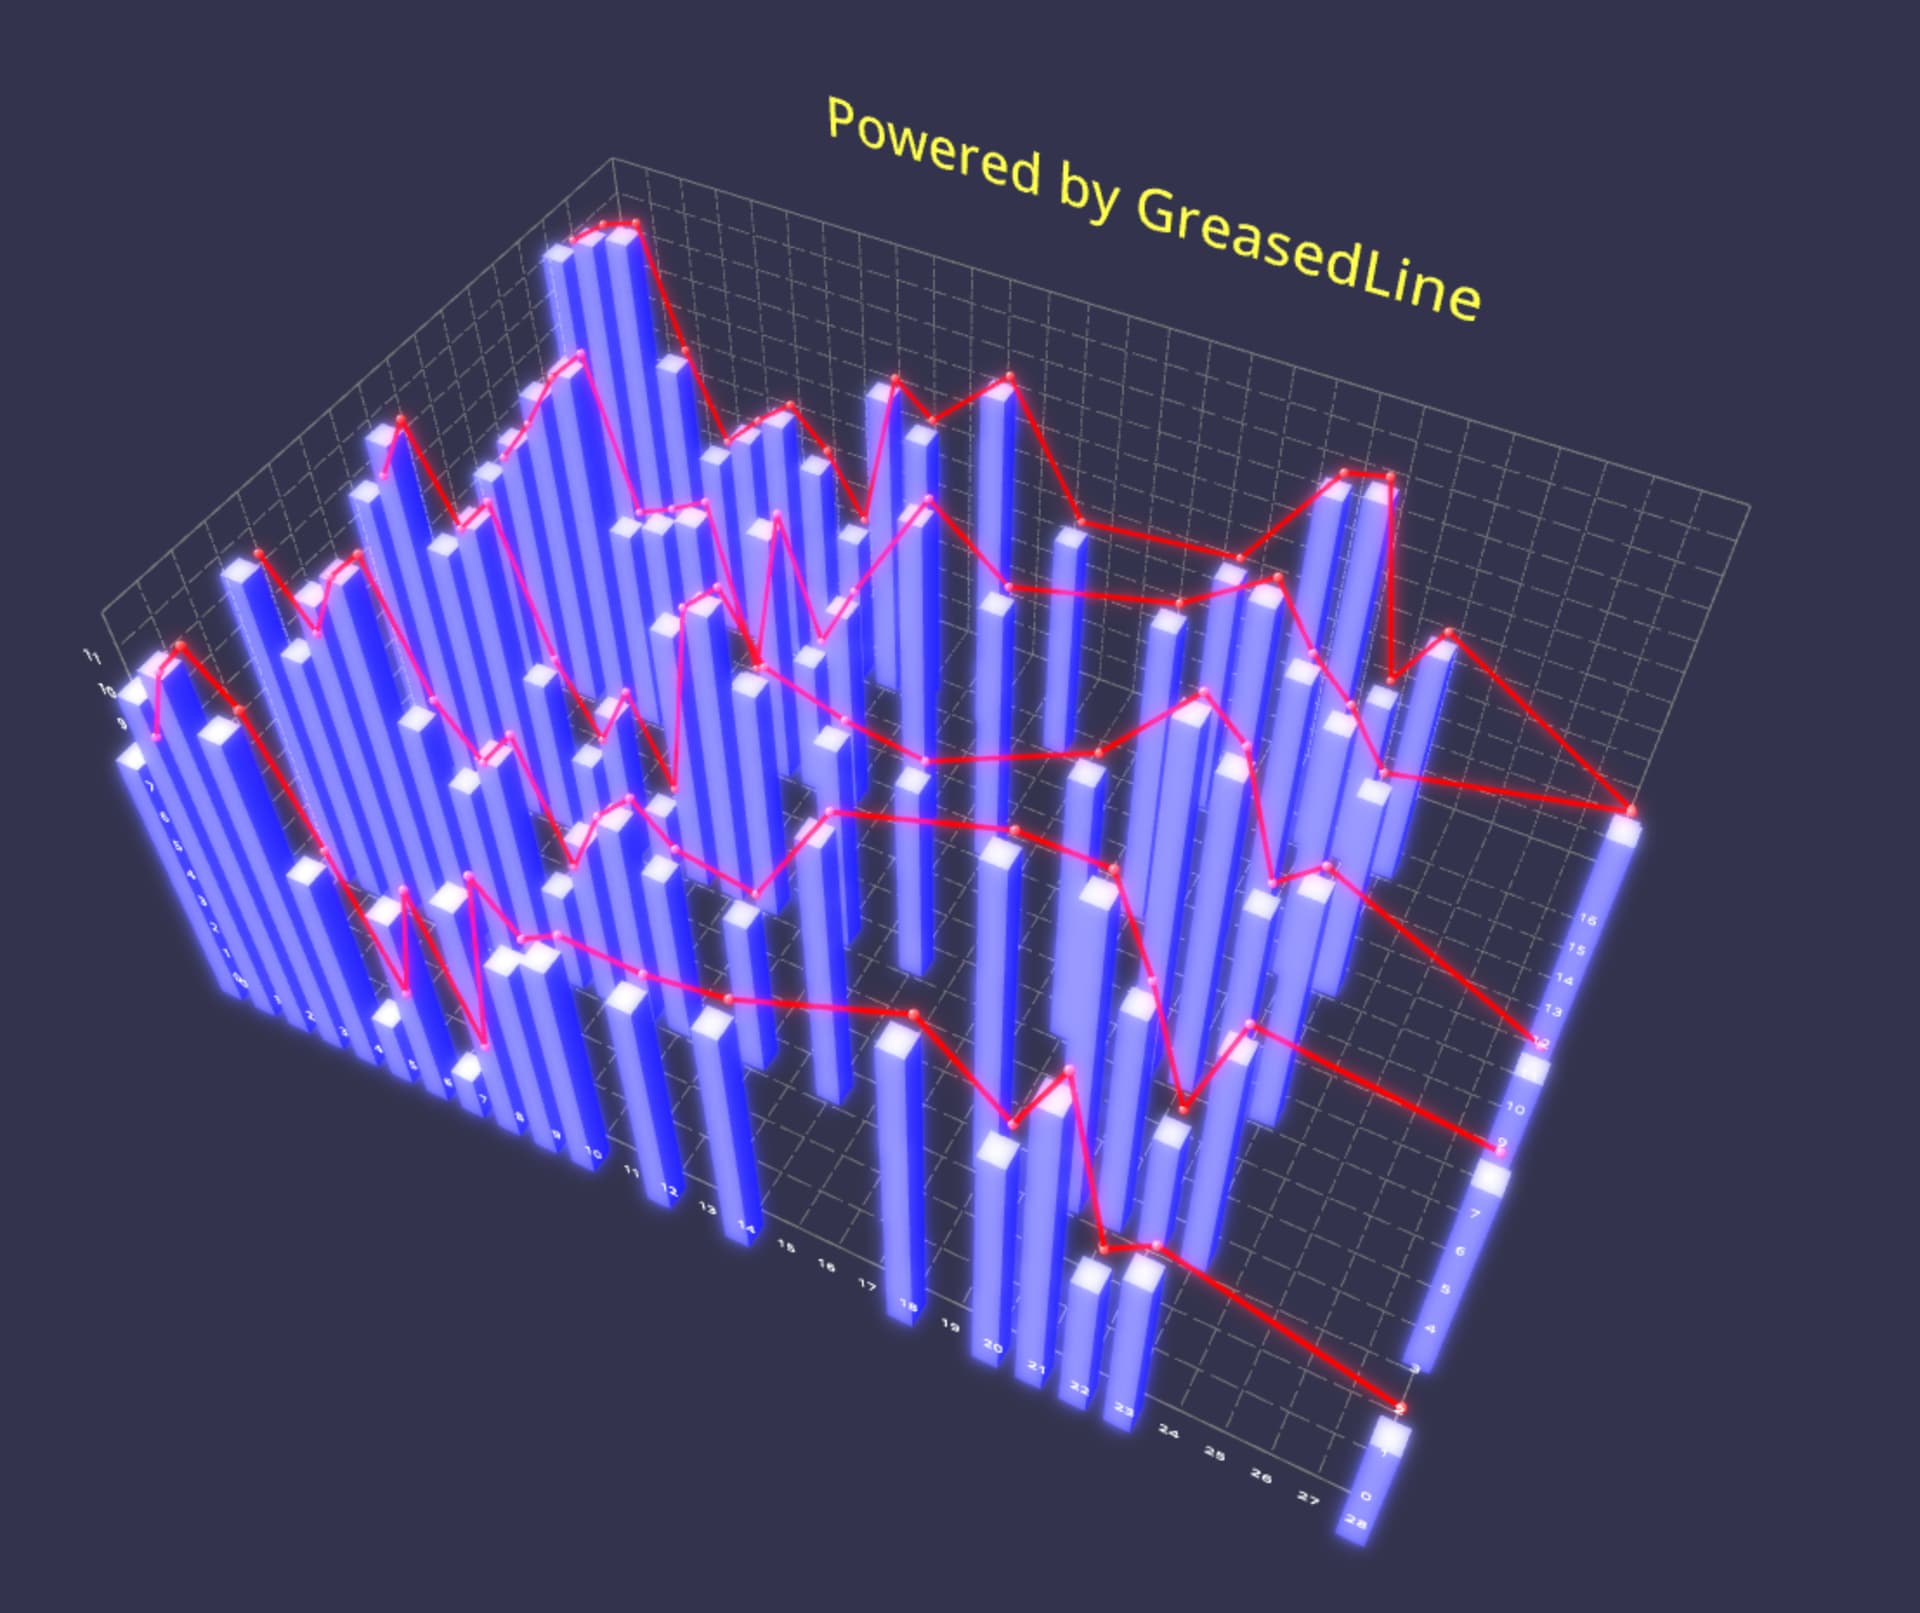
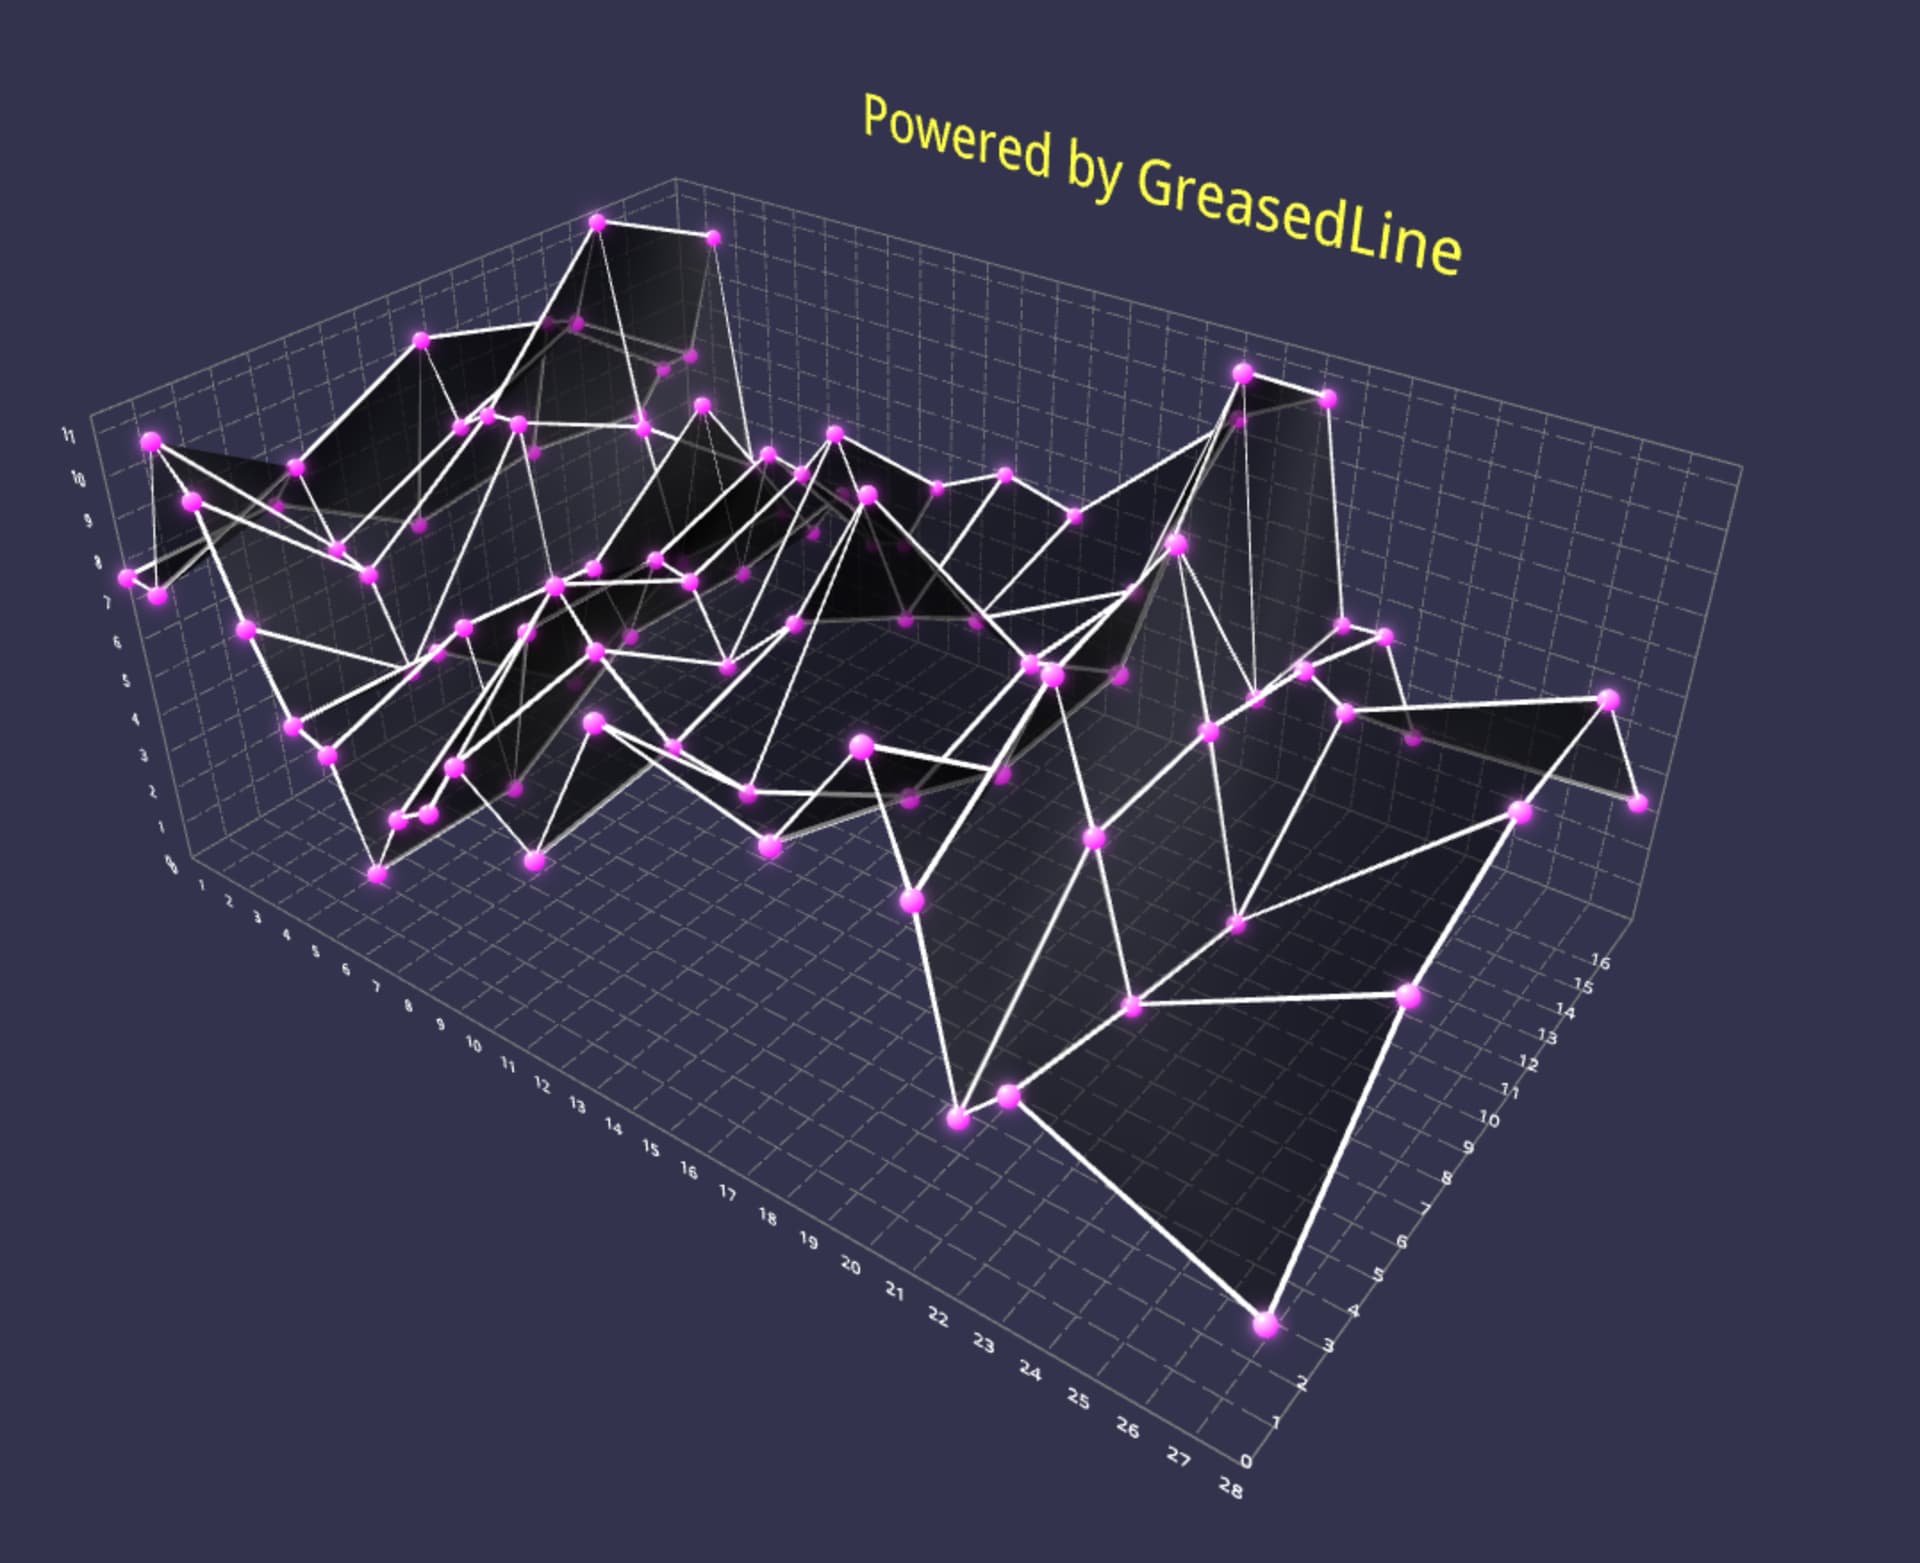
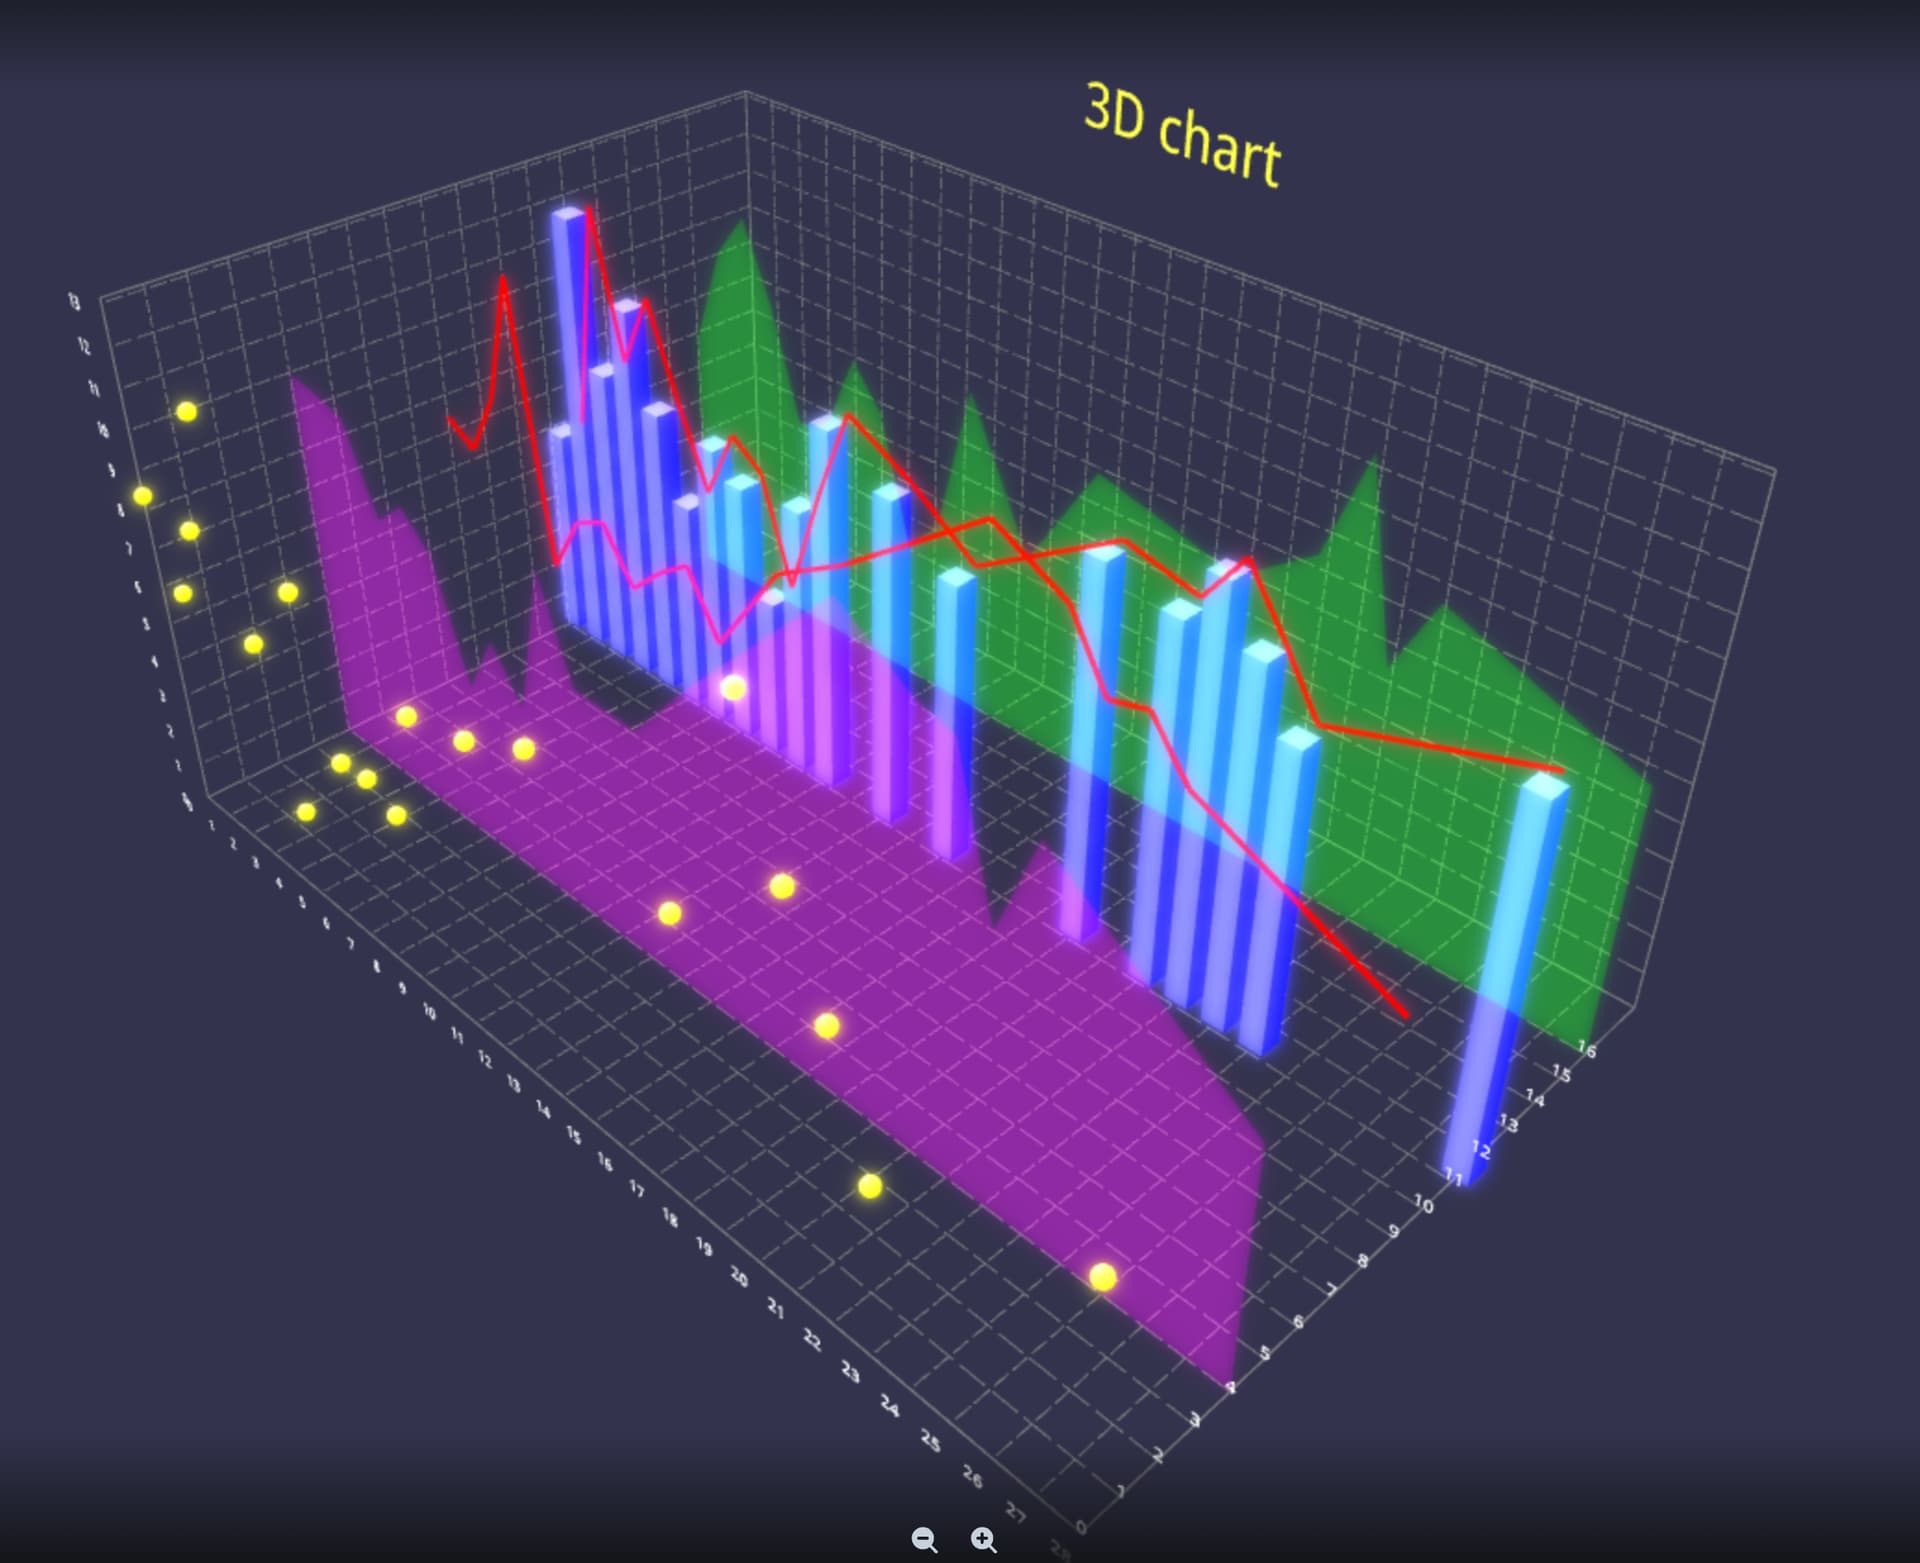
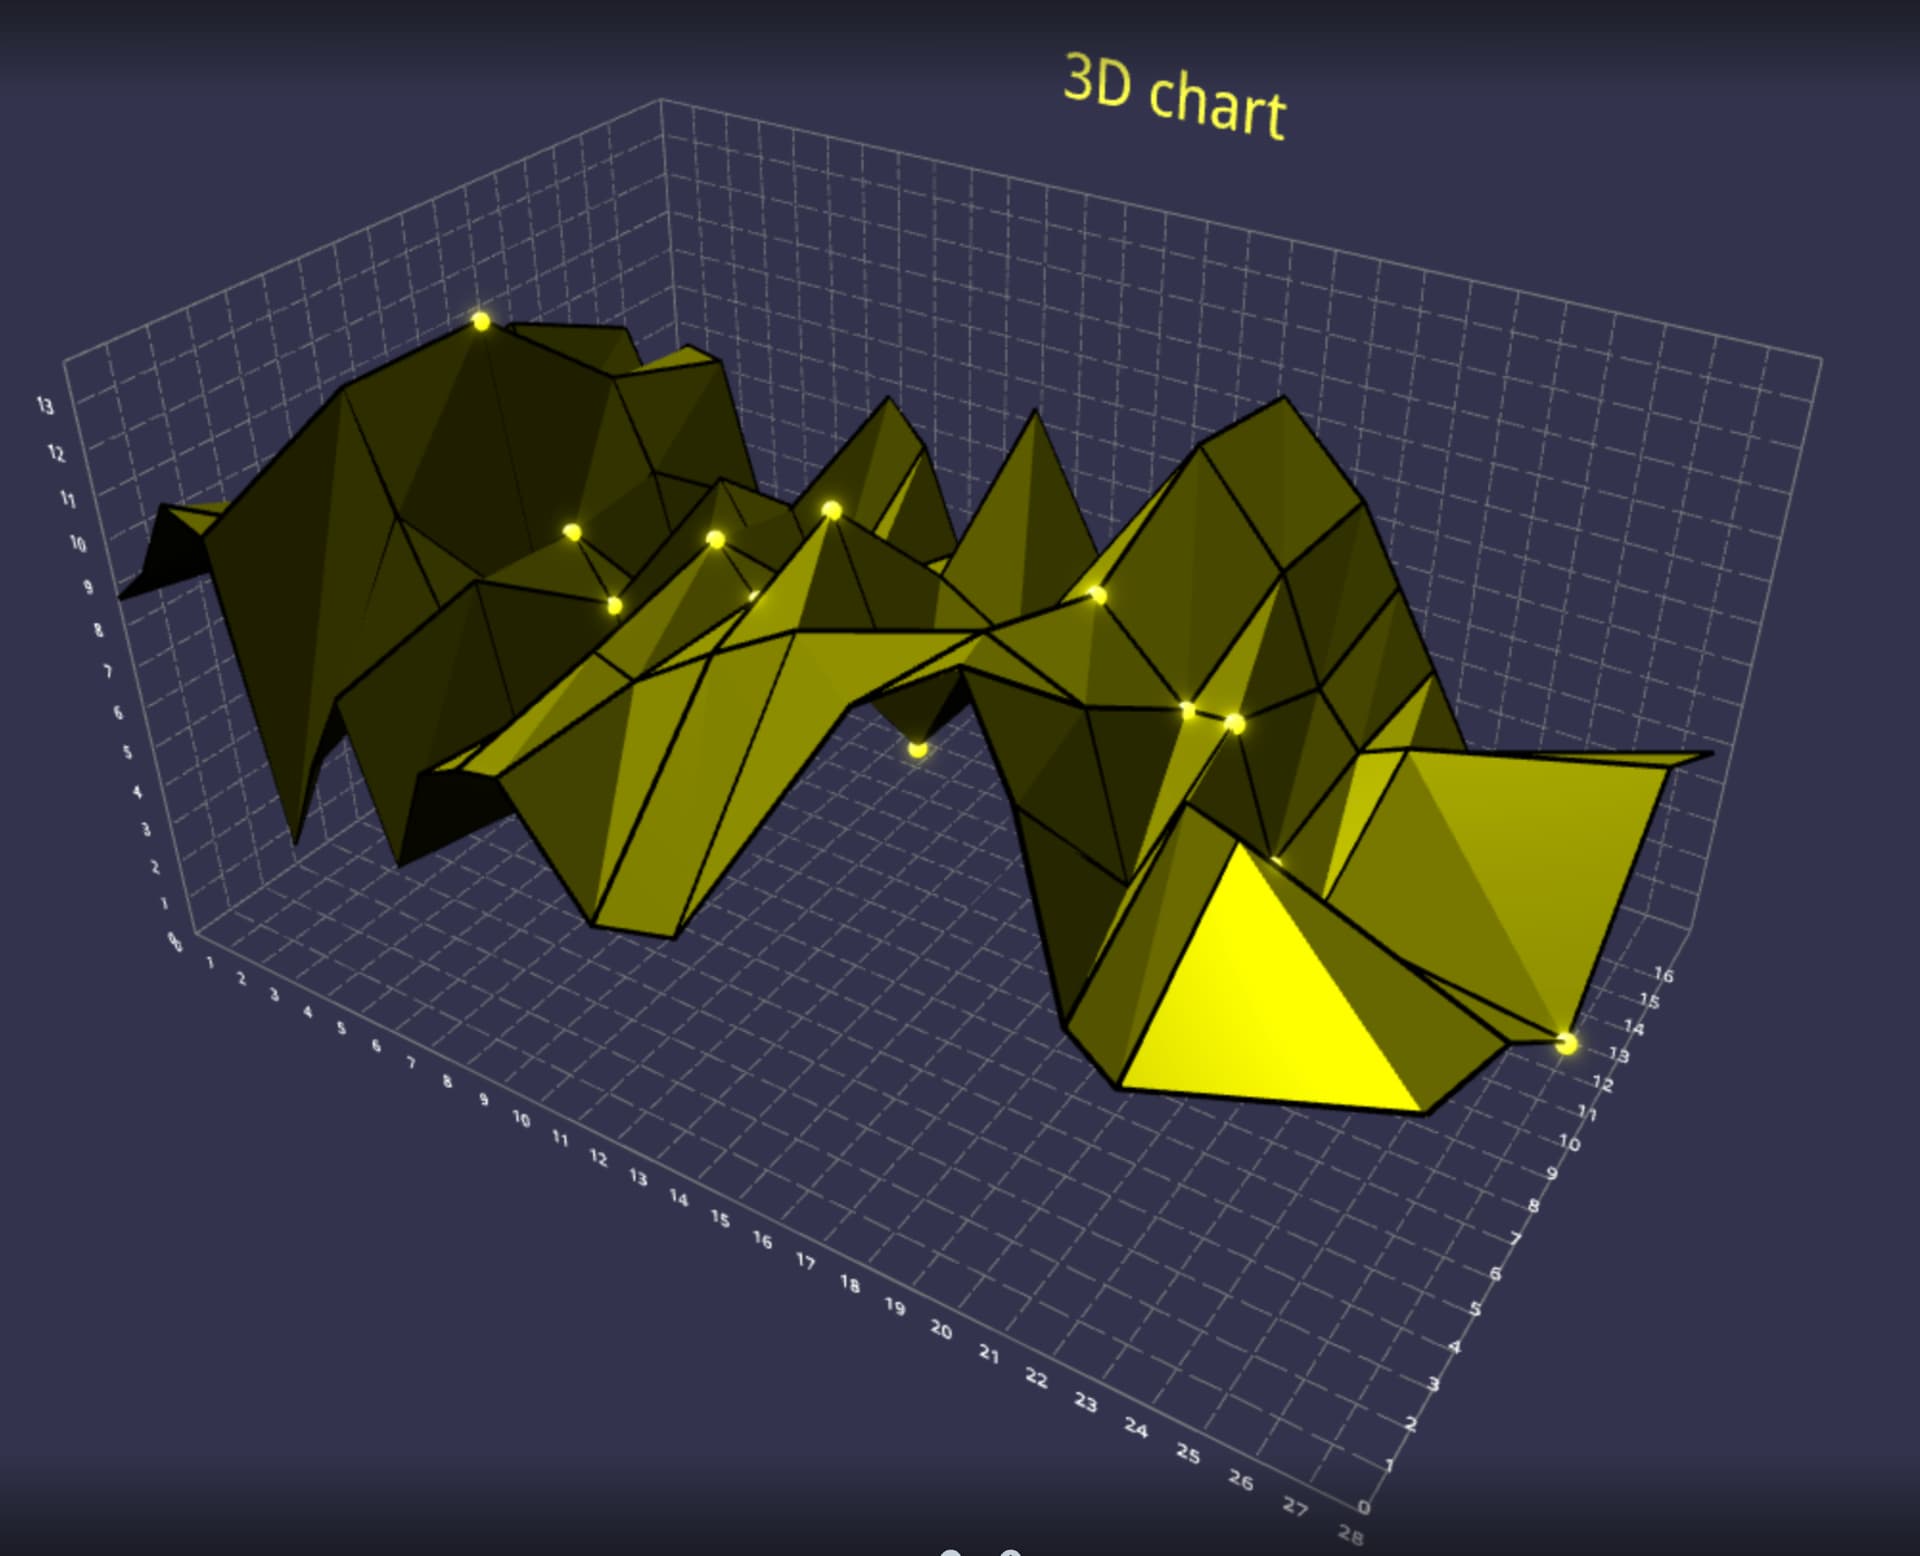
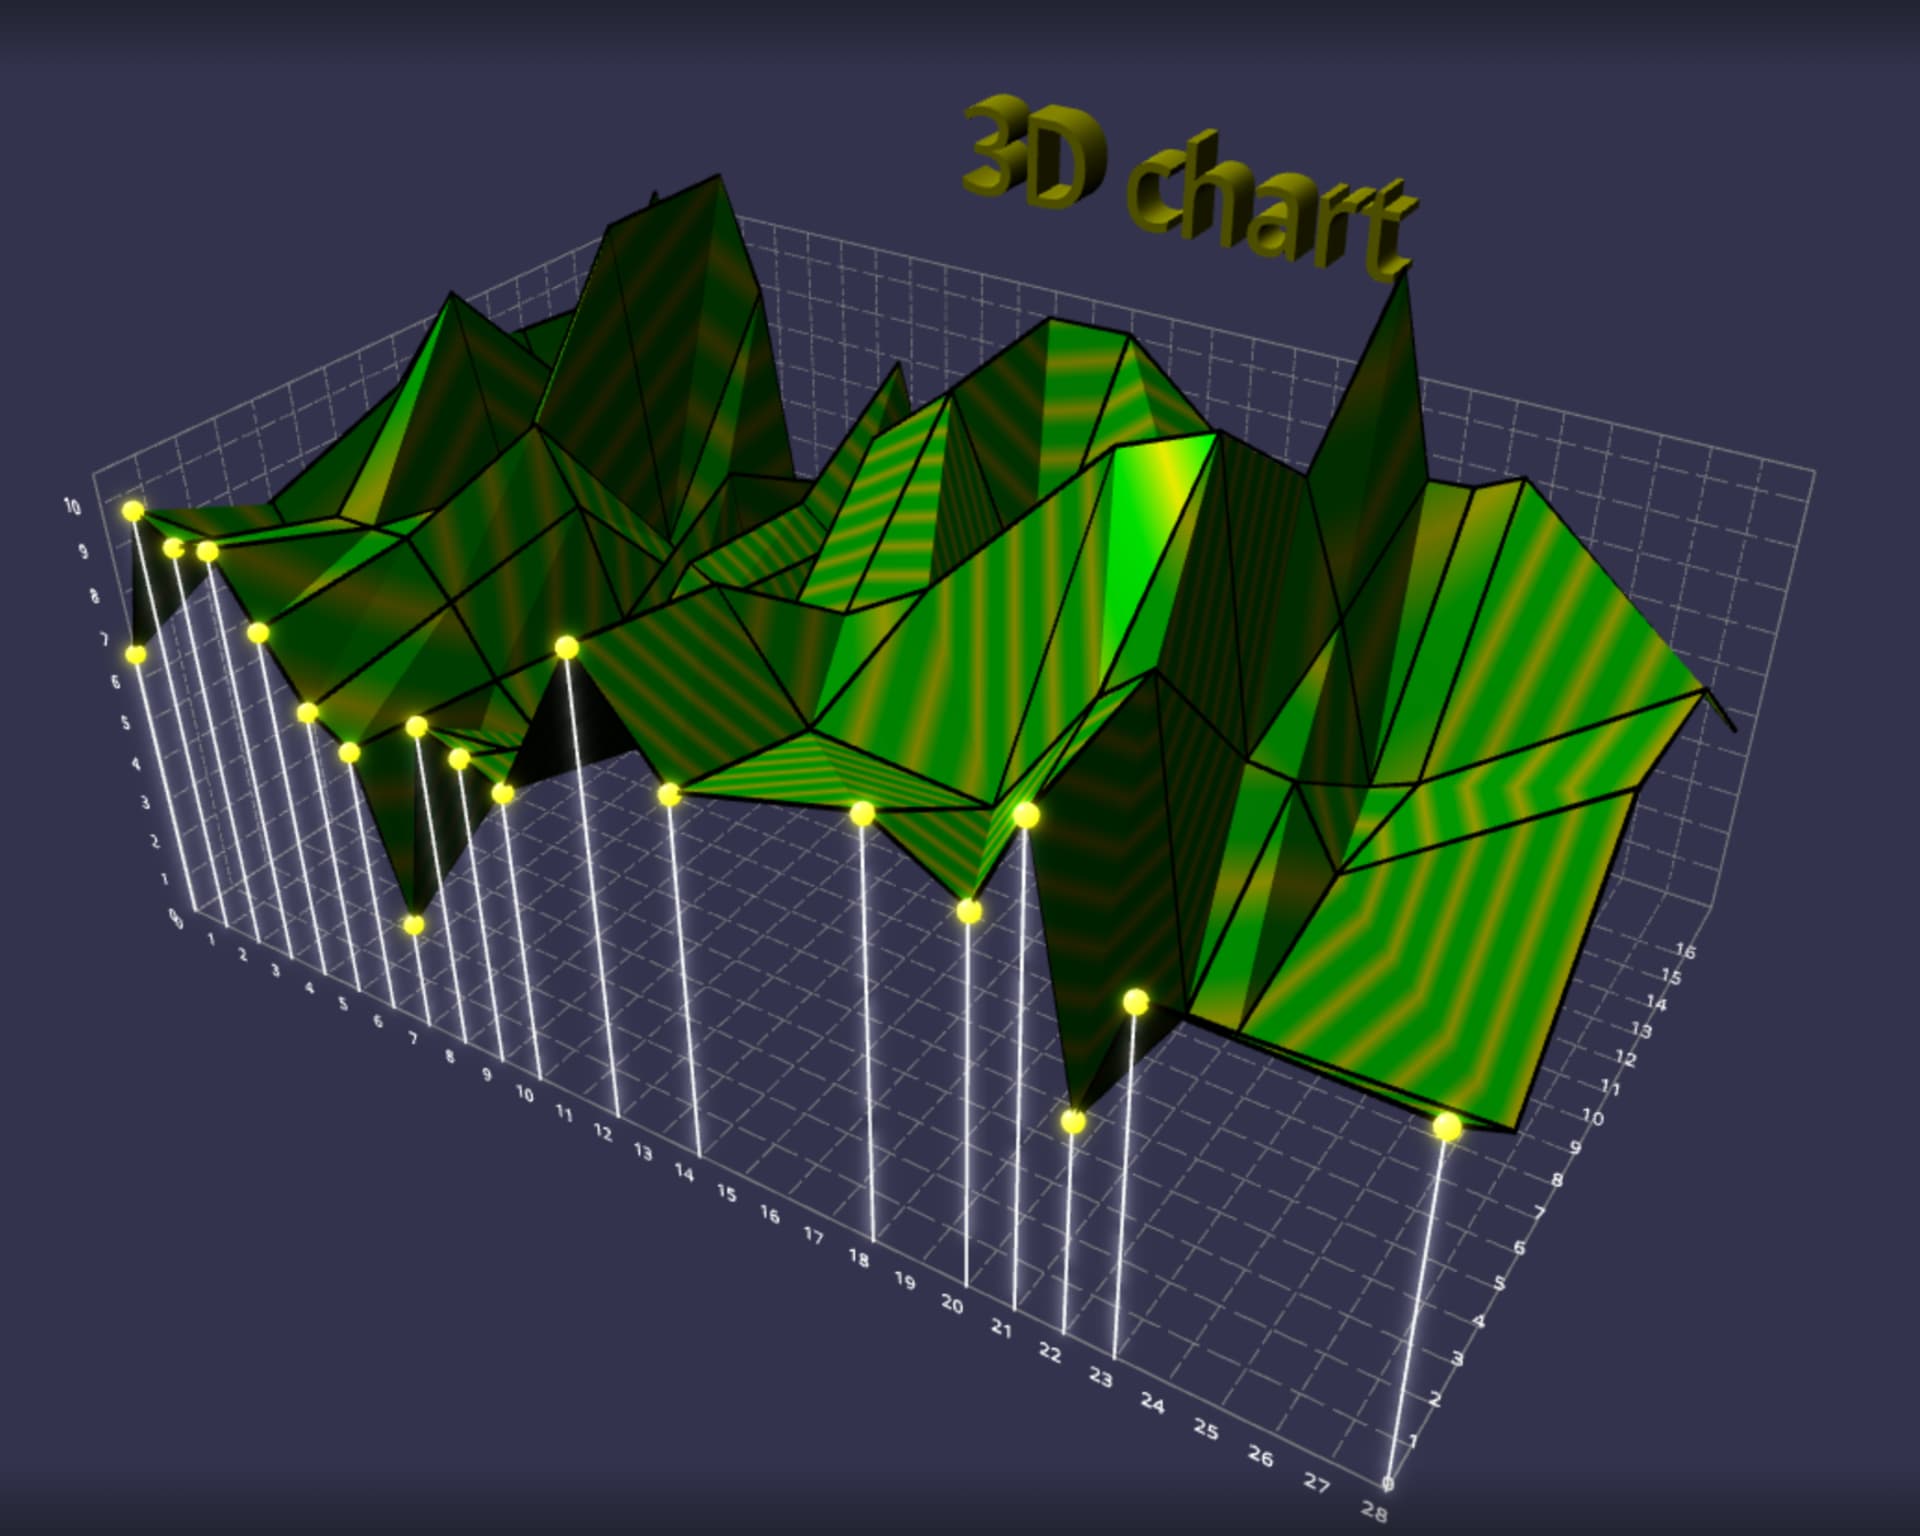
Sorry for the click bait. I wanted maximum attention ![]() I am starting to write a 3D charts library so if anyone interested and maybe you have some experience in the world of charts please join me
I am starting to write a 3D charts library so if anyone interested and maybe you have some experience in the world of charts please join me ![]() thanks!
thanks!
3 Likes
I’ve been working on a D3-style toolkit for Babylon called Anu.js. It is mostly low-level visualization code support, but it should make implementing higher-level Chart libraries much easier : ) This kind of stuff is my bread and butter. I wrote my dissertation on the subject of immersive analytics, so I’m happy to chat about it!
7 Likes
17 Likes
Interesting topic ![]()
I think what will be important is the way you handle charts input data. To my mind the best would a single object data, like in the quite famous Chart.JS library.
I think you can inspire a lot from it :
- Data & Chart Types
. Bar
. Line
. Donut
. Pie
. Polar
. Radar
. Scatter
. 3D surface
. etc… - Scale
- Title
- Subtitles
- Legends
- Tooltips
- Animations
const config = {
  type: 'bar',
  data: data,
  options: {
    responsive: true,
    plugins: {
      legend: {
        position: 'top',
      },
      title: {
        display: true,
        text: 'Chart.js Bar Chart'
      }
    }
  },
};
etc, etc…
++
Tricotou
1 Like
Yep, it’s data driven. One JSON input file.
2 Likes
This is so good buddy!! Reminds me off a discussion 9yo d’about 3d charting. So cool to see it happening
1 Like
HTML5 Game Devs Forum - HTML5GameDevs.com, not too much, but at that time was ![]()
![]()
1 Like
Oh gosh! Internet archeology
3 Likes
Me reading this:

6 Likes
That’s amazing (once again ![]() ). It nearly gives me the desire to return working for marketing excellence to create impacting charts with the sole purpose of transforming a mediocre result for a marketing operation into a potential success
). It nearly gives me the desire to return working for marketing excellence to create impacting charts with the sole purpose of transforming a mediocre result for a marketing operation into a potential success ![]() … ok, may be just ‘nearly’
… ok, may be just ‘nearly’ ![]()
1 Like
This is neat! ![]()
Have a look at our heatmap layer in Smplrspace: https://timeheat.smplrspace.io. You can change the setting between sphere based, grid based, and bar chart when you click the settings button :). It’s automatically interpolated from sparse data, and mapped onto the walled area.
For context, we’re building a floor plan based data visualization tool, that works in both 2D and 3D, and is Babylon.js based (what else? ![]() ). The developer docs has a few other examples: https://docs.smplrspace.com/.
). The developer docs has a few other examples: https://docs.smplrspace.com/.
6 Likes
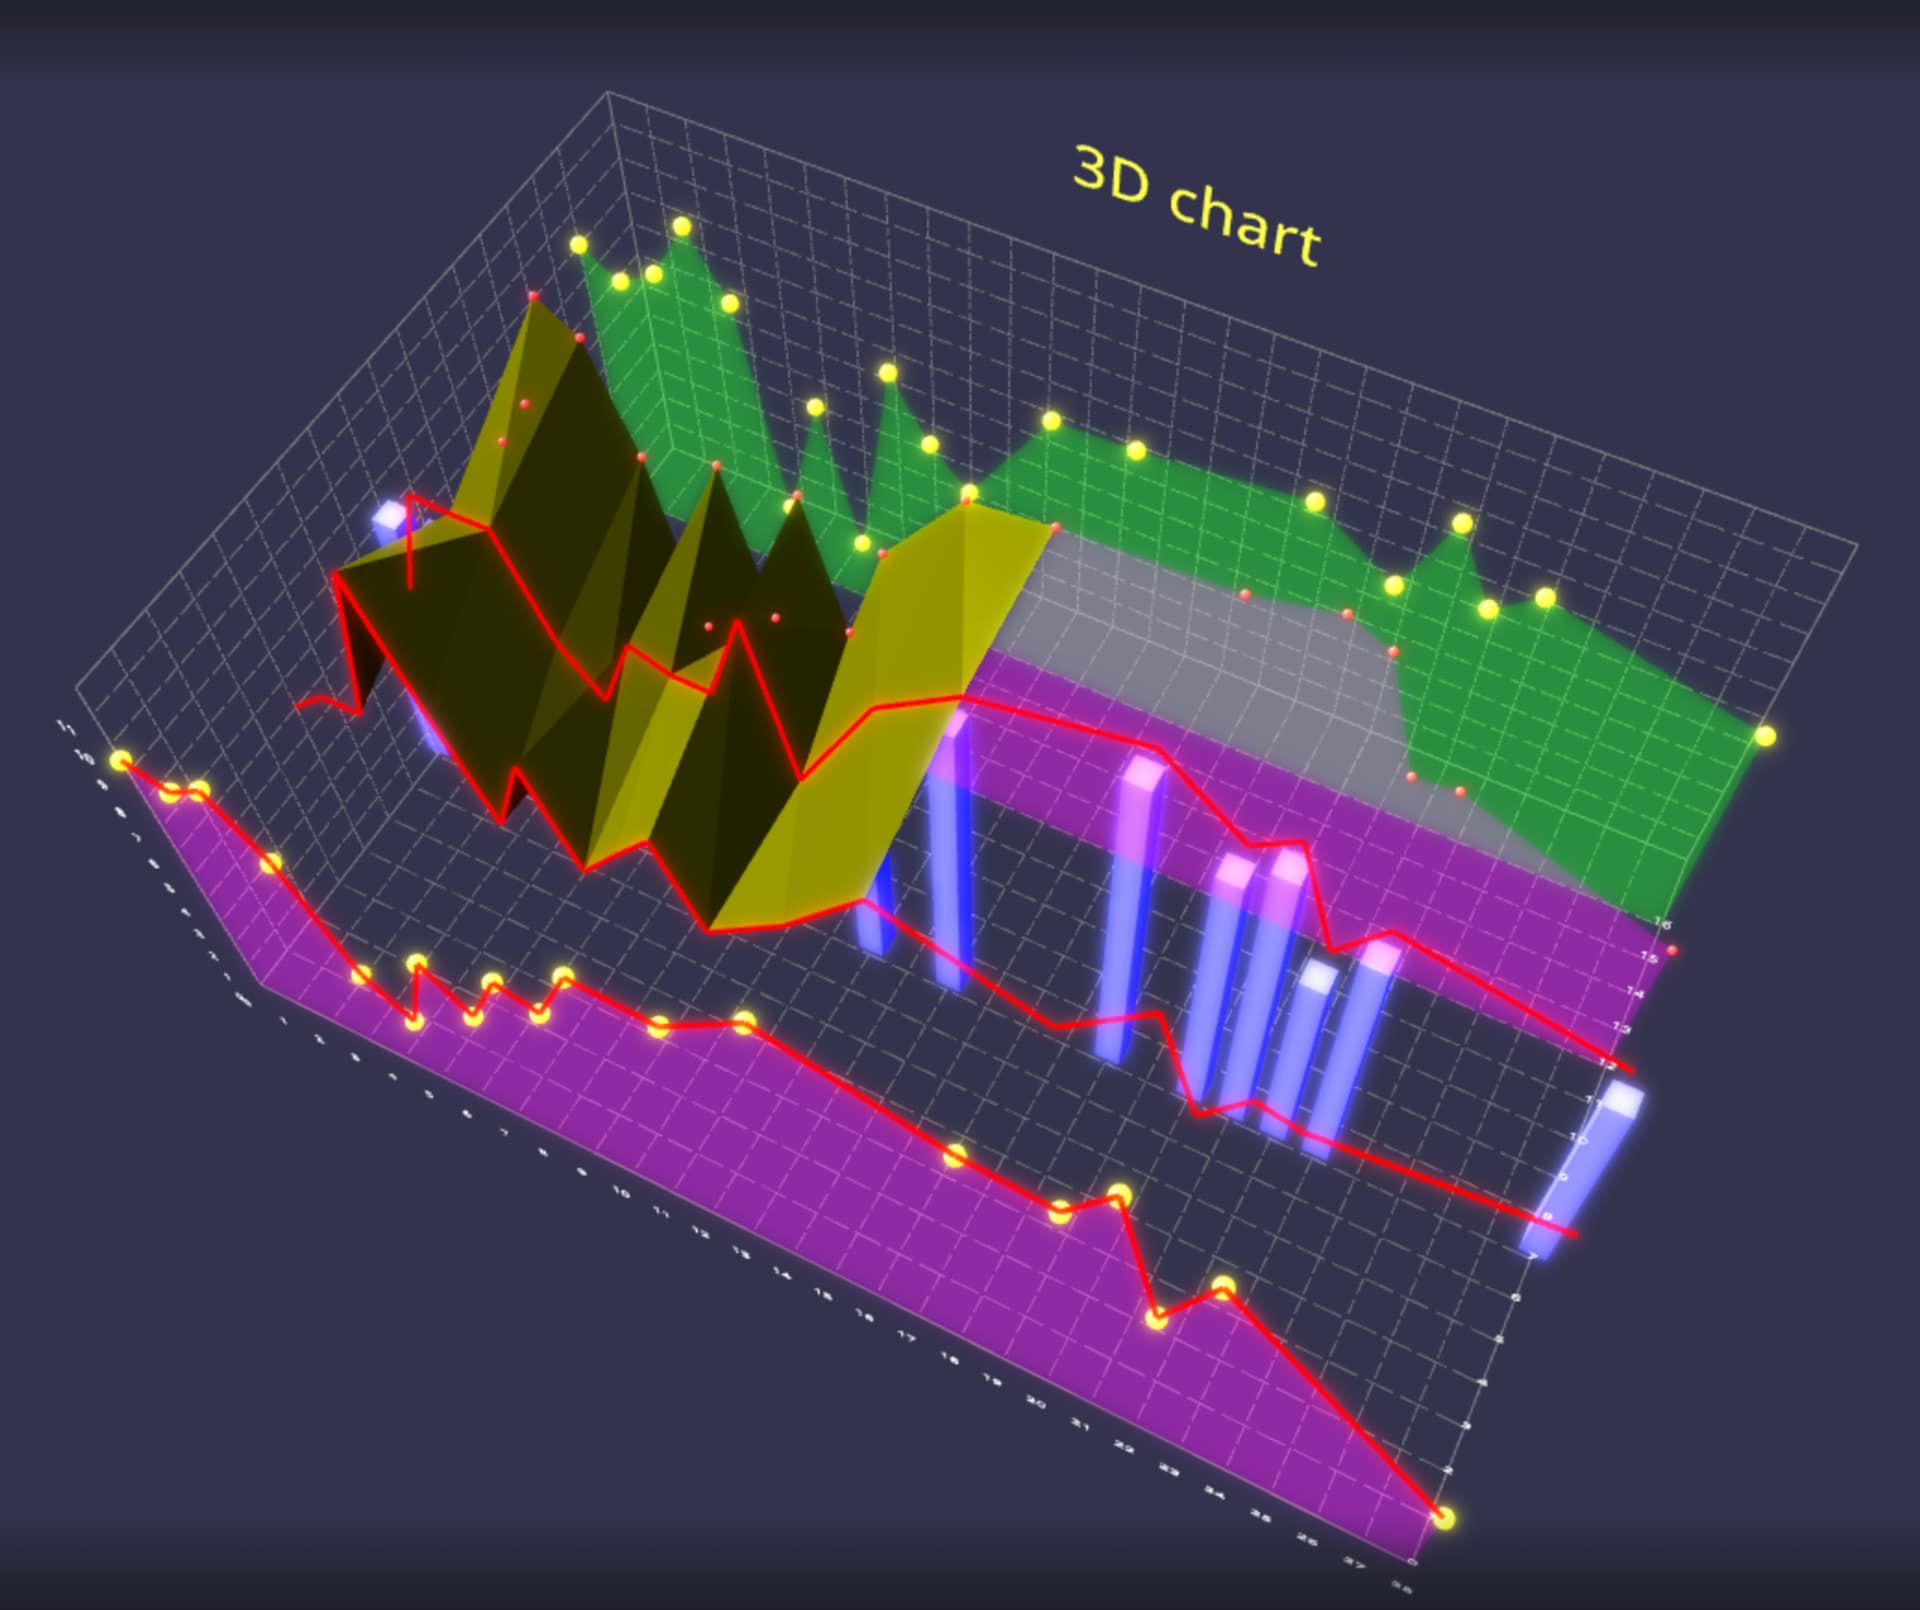
The bar chart looks cool ![]() even better when it is animated!
even better when it is animated!
1 Like
This is damned hard to make it universal ![]()
1 Like
Hello!
I’m working now on data visualization using D3 for our company project and still developing the 3D Charts library. Anu.js is amazing! Kudos!
I was hesitating what approach to use for configuration and data after I encountered D3. The D3 style or the charts.js. I started with the old-school json but the D3 approach is so cool! Finally I chose the json config style, Anu.js is already available so it made the decision easier to make.
However I want to make the charts modifiable to the smallest detail (animate anything anyhow, add interaction, transform whatever, change any attributes on the chart, texturing etc) after the chart was rendered so I try to write code which exposes low level babylonjs stuff the programmer but still encapsulates it a bit to make it easier to make things happen. I’m still not convinced whether I’m heading the right direction though. I rewrote core functionality 2 times already ![]() and now seems I’ll haved to make a quite big change in the format of configuration object… C’est la vie!
and now seems I’ll haved to make a quite big change in the format of configuration object… C’est la vie!
Why is it called Anu? I have to come up with a cool name as well…
Glad you like it!
If you are thinking about a json style format I would suggest looking into Vega and Vega light. They are a visualization gramer that is then used to compile into render instructions for svg or canvas. People have made vr specific version (vria.js for a frame) and (dxr for unity) but they are both not the most robust.
One approach that could help make things encapsulated but also customizable would be to set up the functions to return the bits of the charts as anu selections which users could then manipulate in anyway you can a Babylon mode/mesh. You can use the props() method to set a whole bunch of properties on a group of meshes at once.
In babylonian/Assyrian mythology Anu was the god of creation ![]() . Didn’t realize until after that its also quite a popular name in some places.
. Didn’t realize until after that its also quite a popular name in some places.
1 Like
You’re amazing ![]()
1 Like