ahhhhhhh, so I need to make some sort of mouse over thing enable the render as well then, hmmm gotcha.
Cool cool! I am gonna see how far the decency of this can be pushed.
ahhhhhhh, so I need to make some sort of mouse over thing enable the render as well then, hmmm gotcha.
Cool cool! I am gonna see how far the decency of this can be pushed.
I was able to get up to about 60ish scenes before the page got noticably laggy. And that is with all of them rendering without any breaks.
Figured that might make you happy @Deltakosh
Cool test @Pryme8!
That is for 60 simultaneously rendered scenes.
I wonder about sequential scenes.
How about a slight TEST alteration?
Is it still laggy if only one scene is shown at a time? Does lag occur at 60 or 100 scenes?
EXAMPLE:
setTimeout 10 seconds, switch from one scene to the next… up to 100 scenes.
How many sequential scenes can exist before there is a performance decrease?
If you have a good PG link, I am happy to run that test.
: )
https://playground.babylonjs.com/#LEIZ83
Could prolly edit this just to keep making slots.
aFalcon on it… : )
https://playground.babylonjs.com/#LEIZ83#2
beat you to it <3 the PG lags a little more then my local demo.
mmmmmmm, good old stress tests…
Ok wow, this is interesting… “injected” keeps injecting on rerun. So they accumulate rapidly. You probably knew that. Adding Id to isolate… and can collect those instances back out (if we want).
Or not! 
I see what you did there… spawning a new scene every… half second!
Lol…
Very helpful - we will need 100. Then…
What I’m trying to TEST is slightly different… think MOVIE PICTURE SHOW. : )
One at a time. Lol. Every 10 seconds - show a new scene.
Is that still 60FPS?
Here is a starter with random colors and scrolling flexbox sceneView:
Still working on it…
MULTI-CANVAS-STRESS-TESTS:
TEST: Multi-Canvas Simultaneous 4 scenes
RESULT: ~60FPS
TEST: Multi-Canvas Simultaneous 8 scenes
RESULT: ~50-60FPS
TEST: Multi-Canvas Simultaneous 16 scenes
RESULT: ~40-60FPS
TEST: Multi-Canvas Simultaneous 32 scenes
RESULT: ~30-60FPS
NOW FOR SEQUENTIAL TEST… using 32 scenes HIDDEN and showing one at a time (10 sec).
Is it still ~30-60FPS or 60FPS???
![]()
Any guesses?
![]()
Because (as usual) aFalcon makes a mistake - and it turned out to be a performance optimization. I dont know why.
FIRST - the SEQUENTIAL TEST - 32 scenes (formerly 30FPS) (without the mistake)
RESULT: solid 60FPS (you might’ve guessed)
SECOND - the SEQUENTIAL TEST (with the mistake of NON-REPLACEMENT)
RESULT: SURPRISE! SOLID 60FPS… what???
Anyone know why? aFalcon will just store this away somewhere.
Ok now FOR THE BIG TEST!!!
100 scenes (with replacement) - is there a performance hit???
WARNING: this is DANGEROUS. ![]()
TEST: 100 SEQUENTIAL SCENES - with REPLACEMENT:
RESULT: ~60FPS
TEST it yourself:
CONCLUSION: aFalcon thinks this is GREAT for making Motion~Picture~Shows in BABYLON.
Thanks @Pryme8.
![]() : )
: )
UPDATE: just in case YOU were wondering… and I know you were!
TEST: 1000 scenes
RESULT: 60FPS

I dont know why. And we are going to keep working with this in the future.
@aFalcon - Love it! This rocks! Stress test indeed! And standing up well!
Hi,
I’m trying to implement a toggle between one and four canvases using this new feature in an Angular project. I’m using the example code from the docs.
If you open the project I created in Stackblitz: https://angular-1vgzh3.stackblitz.io/, angular-1vgzh3 - StackBlitz (editable), the CPU going up to 30% without doing anything. I’m using chrome and Angular 7 version.
You can toggle the four canvases by double clicking.
Any suggestions to reduce the CPU usage?
Thanks.
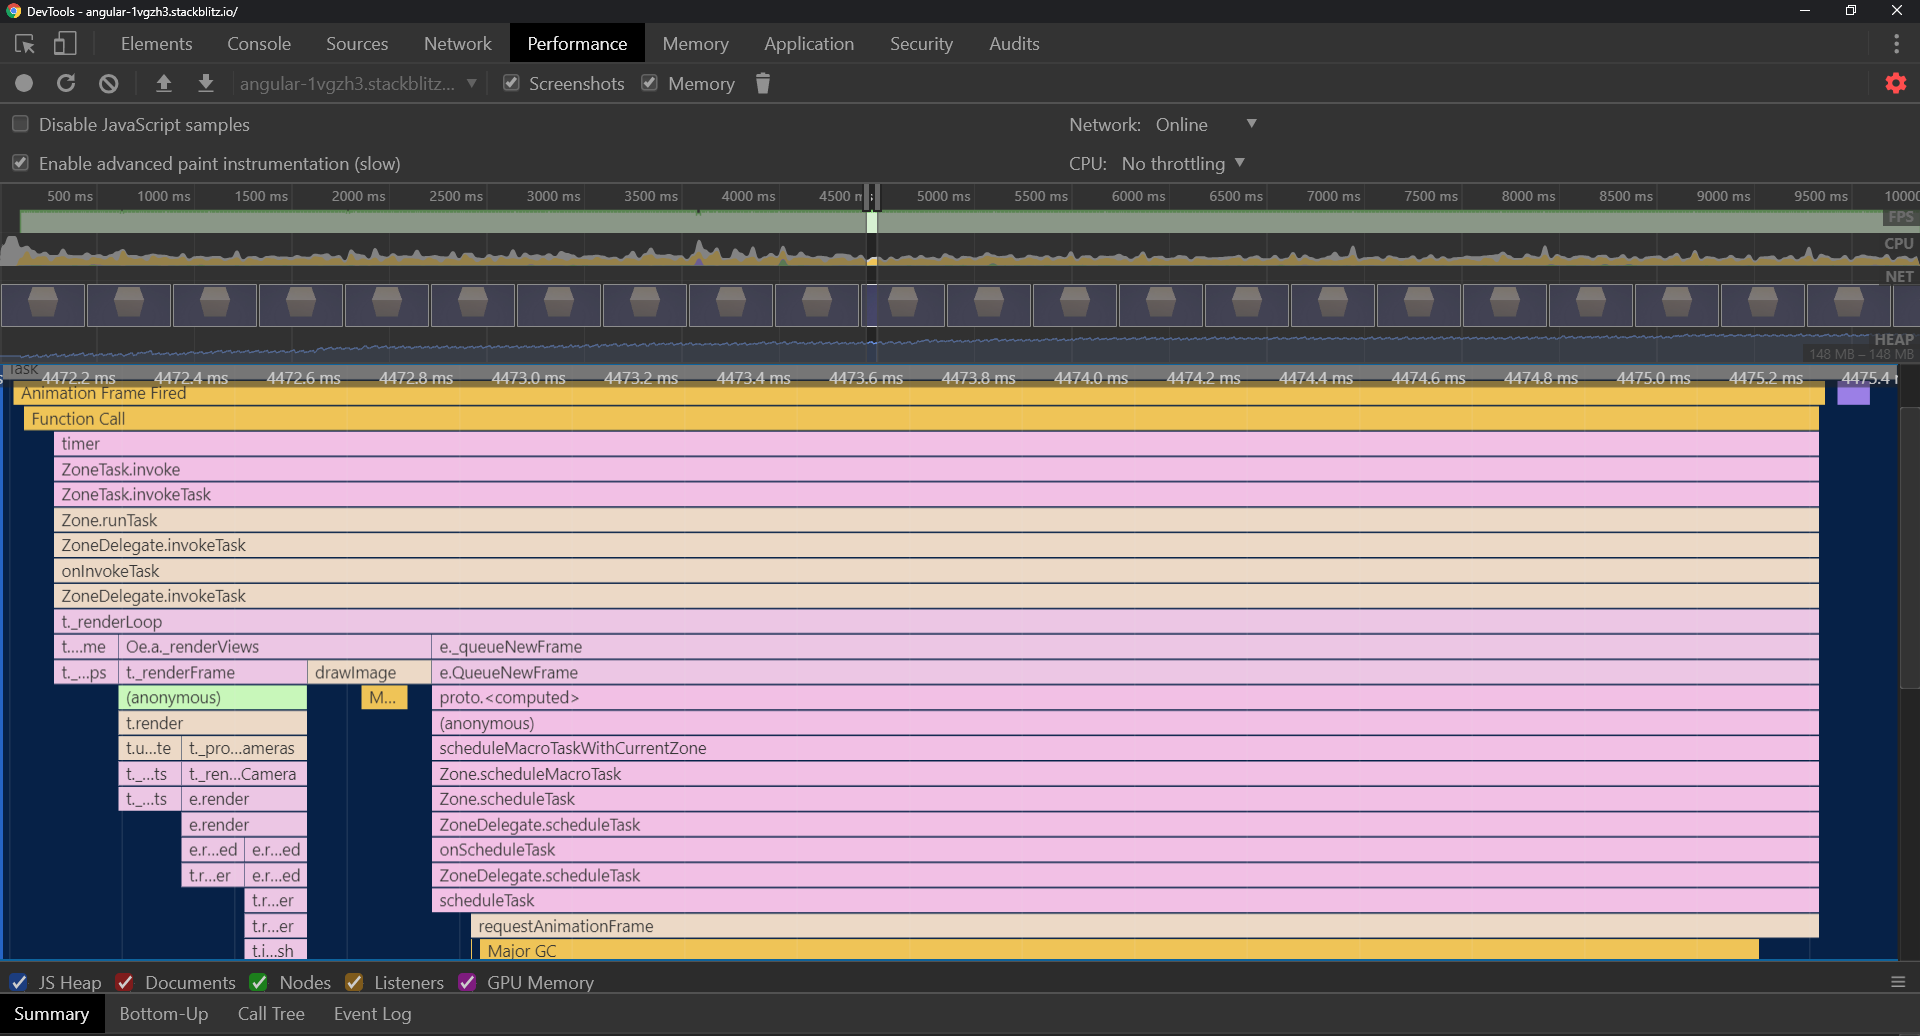
Can you do a profile (using f12 profiler) to see what is eating your CPU?
Well based on your profile I see that he renderViews is ok (it is called per frame to render each views) but you have a GIGANTIC major garbage collect in the second screenshot
This is probably the root cause. And it is coming from your angular code
I expanded Major GC and I think it has to do with the renderViews call, because this only happens after I register the view(s) in the engine.
If I use the same Angular code, but I just create the engine with a single canvas, it just works fine with no performance issues.
Also tried setting zone.js __Zone_disable_requestAnimationFrame = true, which it is now not triggered every frame and the Major GC is not appear anymore in the profiler, but the CPU usage is still very high.
Thanks Deltakosh
Well that must be something else as the code is running well here:
https://www.babylonjs.com/demos/views/
The profile:
Hello Deltakosh,
Thanks for your help. I found some conflicts with Angular, it seems to work fine.
Now, I’m trying to add the “onKeyboardObservable” to the scene, but it doesn’t work with the multi-canvas feature, I’m not getting any input.
scene.onKeyboardObservable.add((kbInfo) => {
switch (kbInfo.type) {
case BABYLON.KeyboardEventTypes.KEYDOWN:
console.log("KEY DOWN: ", kbInfo.event.key);
break;
case BABYLON.KeyboardEventTypes.KEYUP:
console.log("KEY UP: ", kbInfo.event.keyCode);
break;
}
});
Thanks.
Can you repro in the playground?
Yes, here is the link to the playground: https://playground.babylonjs.com/#IDV1K2#8
Thanks.