I have a real-time ML model executing on GPU using WebGL and its always competing with resources with BabylonJS scene that visualizes results from the model.
When ML model is paused, babylon both engine.getFps() and engine.performanceMonitor.averageFPS return ~144 which is a refresh rate of my display.
When model is running, that drops to ~20 fps.
But the thing is, there are different user scenarios:
a) smooth visualization or b) as-fast-as-possible ML results.
for (a) I know how to slow down ML processing
and that does free up resources so babylon fps rendering speeds up
for (b) Question is how can I artificially slow down babylon rendering loop
(to lets say target of 5FPS) to free up as much resources as possible for ML?
I’ve looked at engine timeStep option, but that doesn’t appear to do the trick.
And using scene optimizer is exactly the opposite of what I need.
I do not know what ML is, but here goes. Fun fact, I do not believe you have to have an actual render “LOOP” for BJS. You just need to call scene.render(). If you have a different process which runs over and over that is used for input to a scene, seems like you could just put the render at the end.
Probably, not going to dramatically increase rates, there is only so much time in a second. Would eliminate un- necessary render when the “input” has not changed yet.
Wouldn’t the simplest way just be when in that low FPS mode mode, in your render loop check if lastTickTime + some ms constant is < currentTime and don’t perform whatever logic/render until then
And engine.getFps() or in INSPECTOR it calculates FPS correctly
But for me it is still frustrating that I cant setup such basic thing like fps or tick rate for using default engine.runRenderLoop and need develop main RenderLoop by myself.
Thank you! I just read the reply to my message and to be honest I haven’t quite figured out what’s going on here yet and such a task would be a bit of a challenge for me. Anyway - I’m still too new to ask such things, as I may simply be doing it incorrectly or simply not have all the available information on the matter.
This is actually mega helpful for debugging! Thank you!!
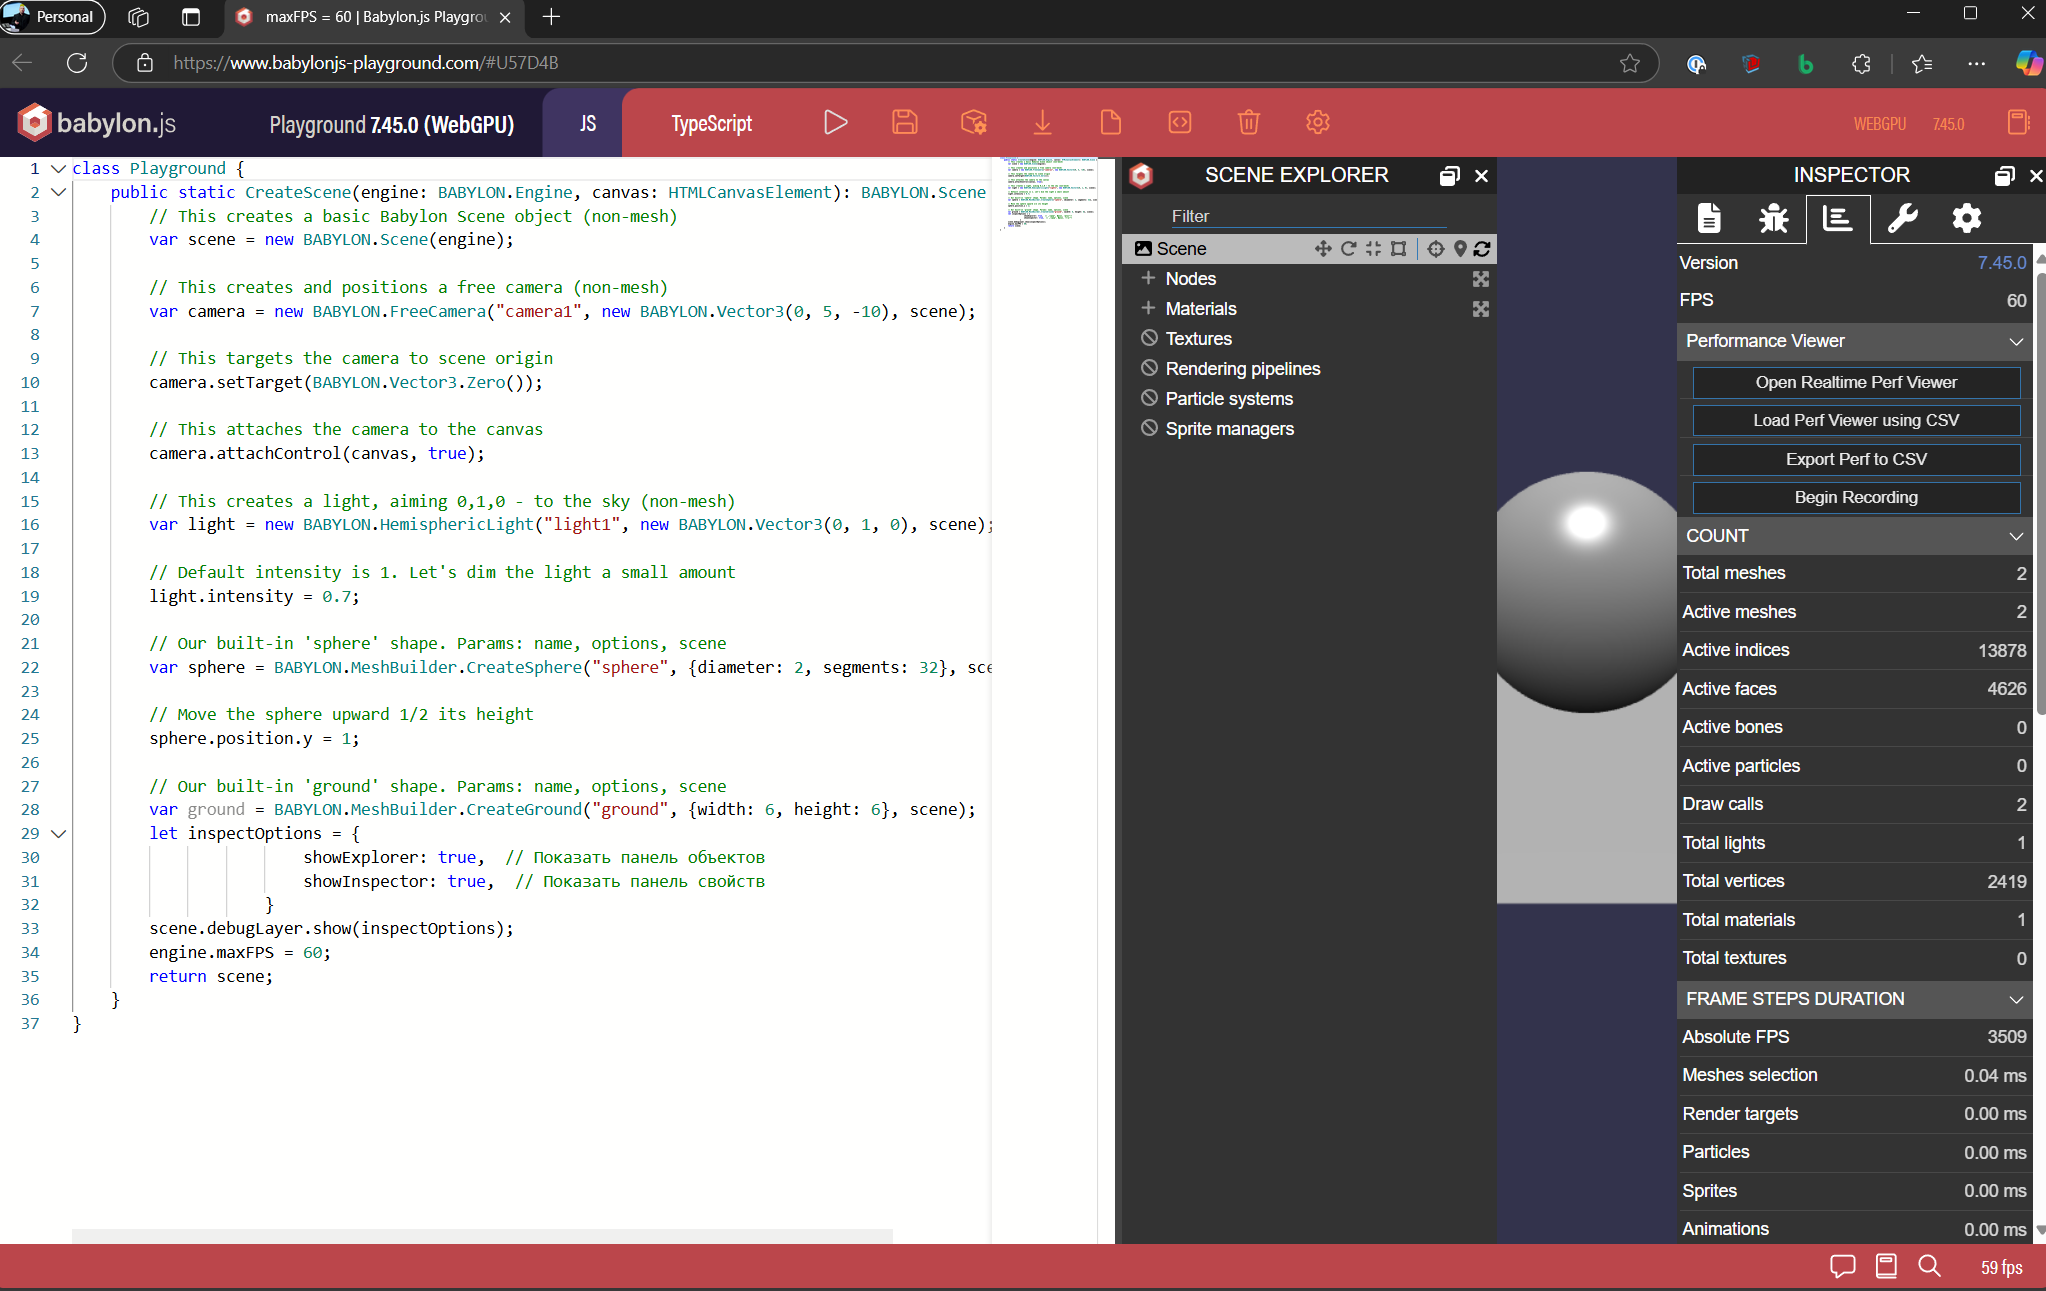
May I ask here, is the bottom right fps counter (in the playground) supposed to reflect the maxFps value (assuming it could go over)? Because there are some values that seem to be rounded or so:
Just tested this feature and how have some questions.
Why if going threw custom loop with engine.beginFrame(); and engine.endFrame(); - it show maximally close to target fps, but if I use this new feature - engine.maxFPS - when I setting 90 - it stucked at 72 fps, and if 60 - it stucked at 48.
If I use this._engine.beginFrame(); and this._engine.endFrame(); inside the this._engine.runRenderLoop(() => {
It shows 96 with maxFPS 60…
144
maybe its because of freesync or something else, seems like its client browser/driver/OS side…
I’ve tested in chrome and firefox - same result
Putting 75 - getting 72. Strange thing.