You should use the Performance tab of your browser to know where the CPU time is spent.
It seems you have quite a number of bones, maybe the skeleton animation functions are taking a sizable chunk of the time.
My current plate is full, I don’t really have time to dig into such issues at the time, sorry. Best to stick with the forum where anyone can jump in and try to help.
Thin instances don’t create indices/faces, but the total indices/triangles are updated to account for the number of thin instances displayed. So, if in your scene you have a mesh which is a single triangle that is thin instanced 10 times, you will have Total vertices = 3 but Active indices = 30 and Active faces = 10.
on my computer I viewed in task manager that GPU is using almost 1G memory and CPU also around 1GB memory for my scene. The device generating above error has 4GB of RAM.
As far as I see, the scene is just too complex, it is really hard for mobiles. You may try first to reduce the number of bones/animations; after this - to simplify geometry as much as possible.
Last resort - to set engine.setHardwareScalingLevel to some value bigger than 1, to have less load on GPU (visual quality would decrease with this).
I am not loading animation meshes ( they are different gltf files) into scene on mobile. scene size is just 5mb. The above error I posted doesn’t even used any thininstance, just loaded materials ( max material size is 1024X1024, all power of two with ktx2/draco compression) . I have this feeling it is being caused by custom materials.
here are stats from scene’s gltf file from sandbox:
You may try, for testing purposes, dispose all materials except one, then adding one by one and see what will happen.
Are you sure that there is no memory leak in your code? Try to check values of performance.memory.usedJSHeapSize
in render loop; if it grows to the performance.memory.jsHeapSizeLimit you definitely have memory leak
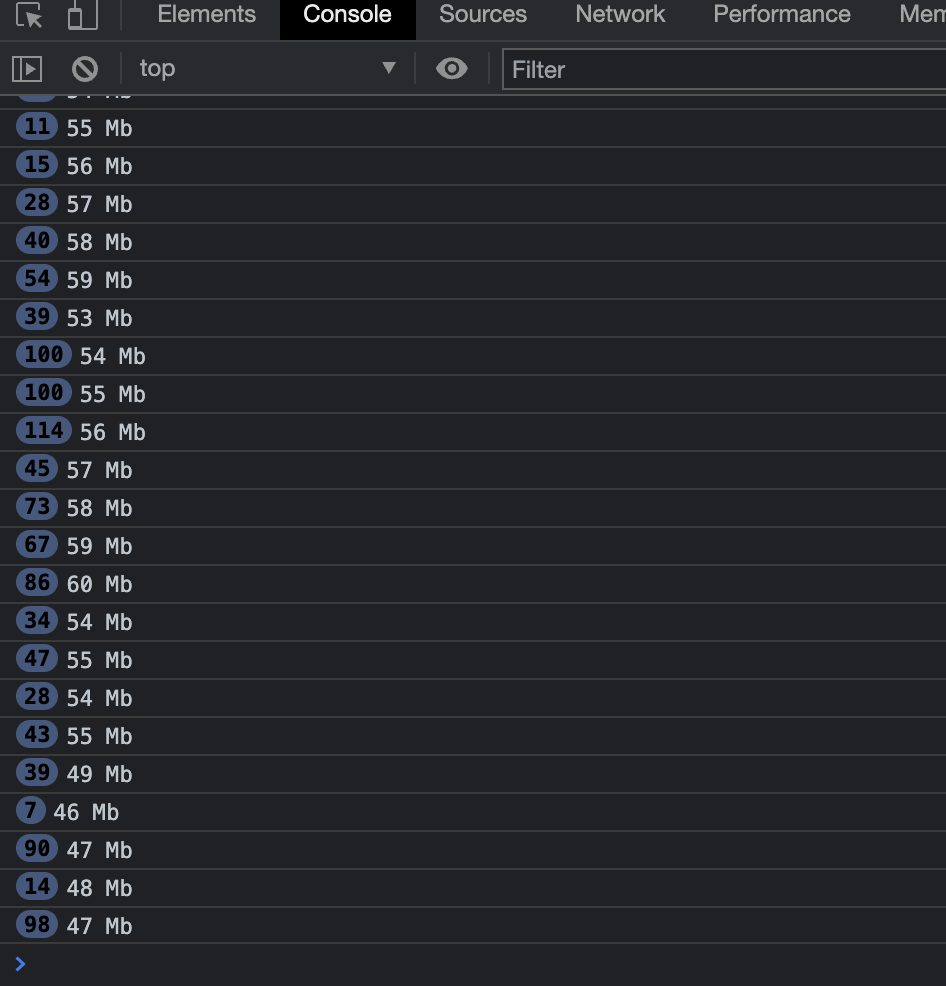
I tried performance.memory.usedJSHeapSize and noticed it started from 43978482 and increased with random numbers ( max at 93675640) than keep decreasing ( last at 47452468 )
I don’t own that kind of mobile device so its a bit hard for me to debug, I am setting up an emulator now to test and will report back. thanks
(probably these were 2 different scenes?)
If the model is lightweight (so we may exclude geometry and animations problems) and dynamic memory usage is low, the most possible thing which loads CPU so hard is some code in render loop. For GPU it can be also some heavy postprocess(es), but I think you don’t use them much.
sort of, I just have one static scene for mobile ( without animations and heavy geometry), the one you see in above image displaying memory is static one, but with animated it also does not go above 230 mb. It seems more issue on CPU side.
I have just used one small call in render loop but even after removing it still issue remained, I have this feeling something is going funny on few mobile devices, I tried in emulator but there it seems to work, I guess I will get a similar mobile which has issues to test it, since I have been just receiving feedback of the error from users so its hard to debug.
Finally I was able to figure this issue, It was being cause by addBinaryFileTask, I was loading a mp3 of around 6mb size, which was causing to crash the app on some devices. as soon I removed this task and file all was working fine.