Performance optimization for activeMeshes / memory leak issue with freezeActiveMeshes

So I found yet another memory leak in my application today (I swear everytime I optimize something I break something else) - I need just general brainstorming and or approval as to whether what I am doing will work or not, or how to go about doing something of the sort in a better manner.

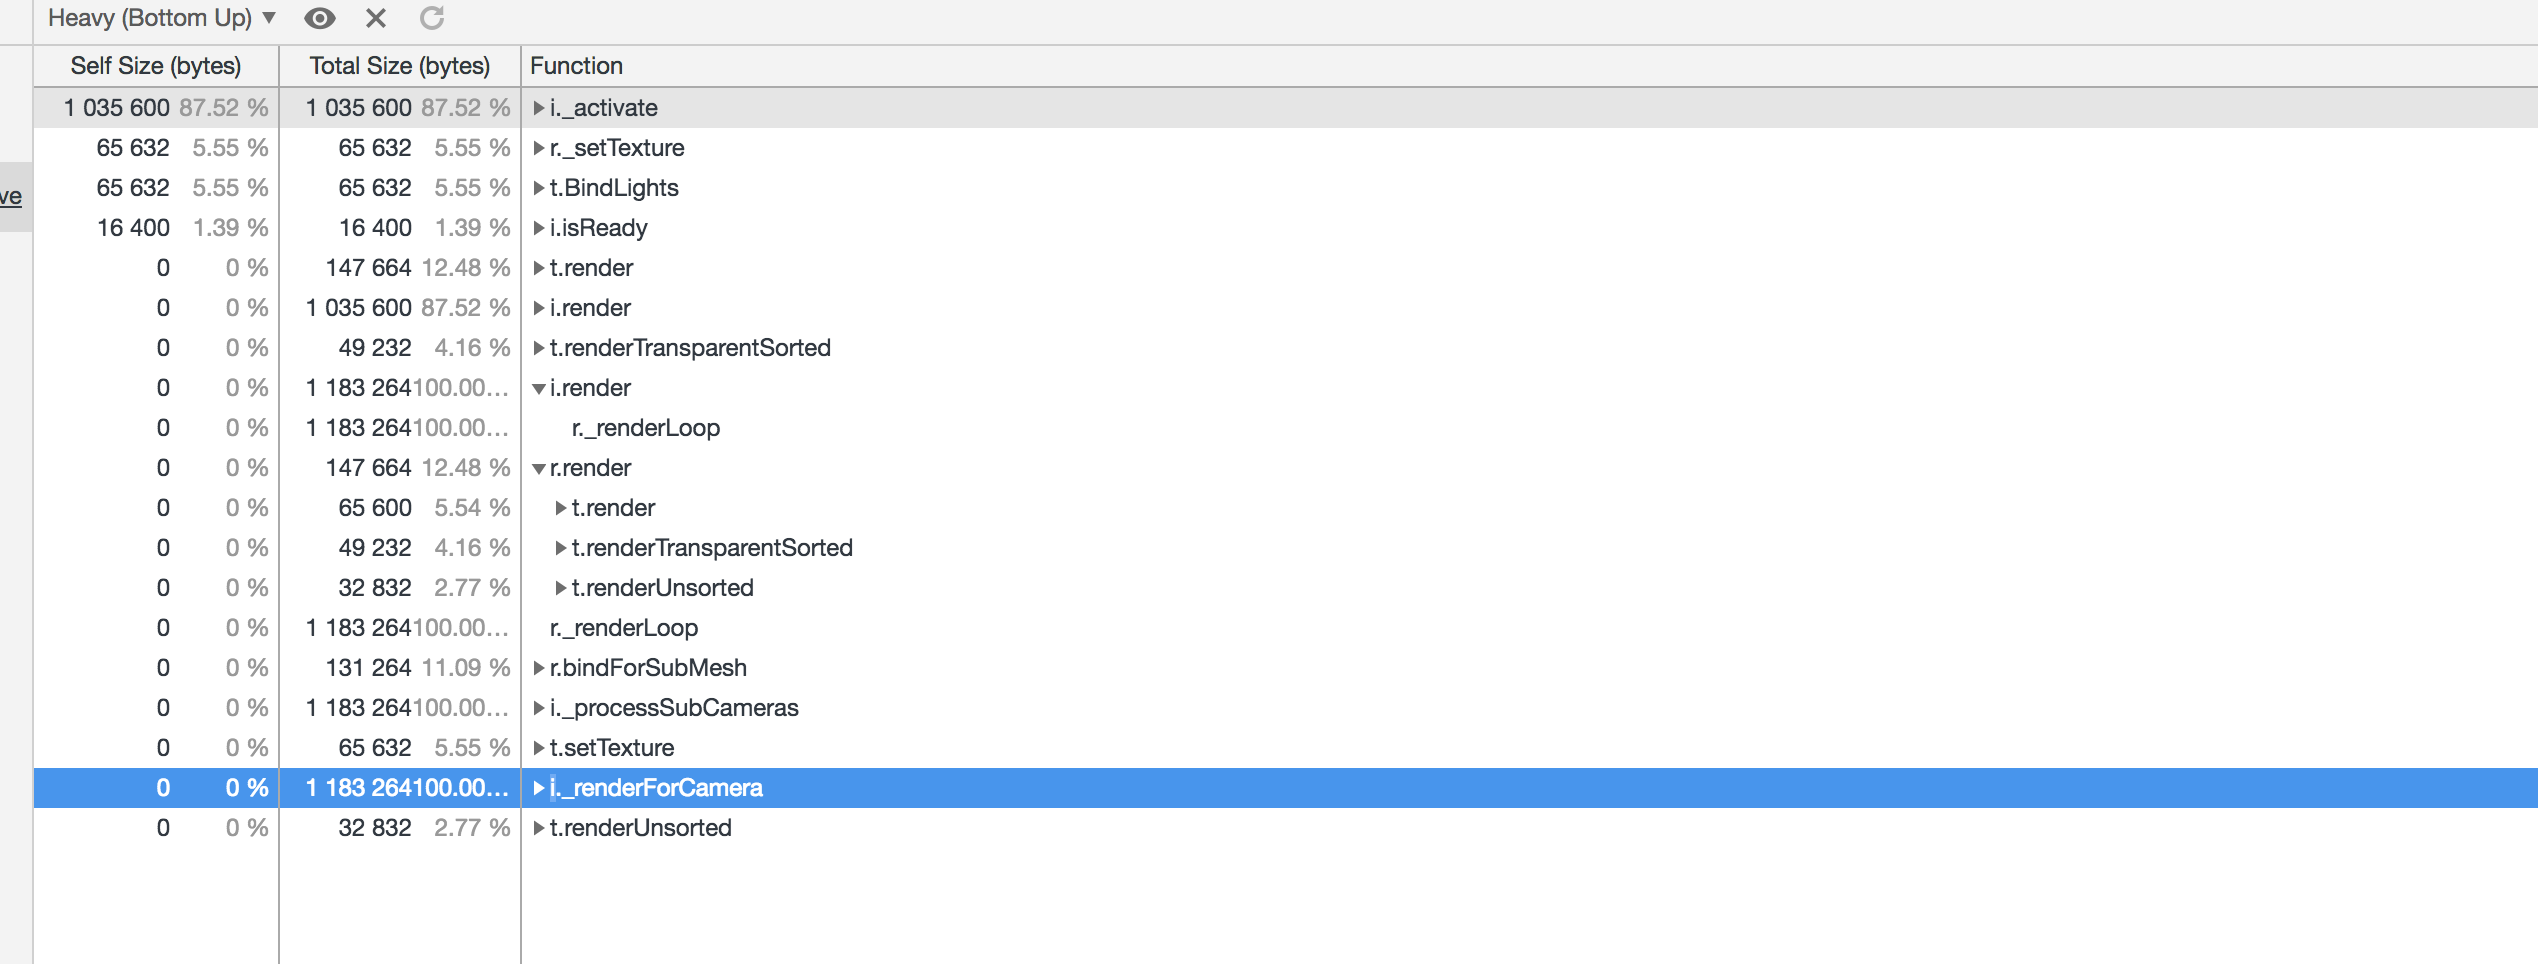
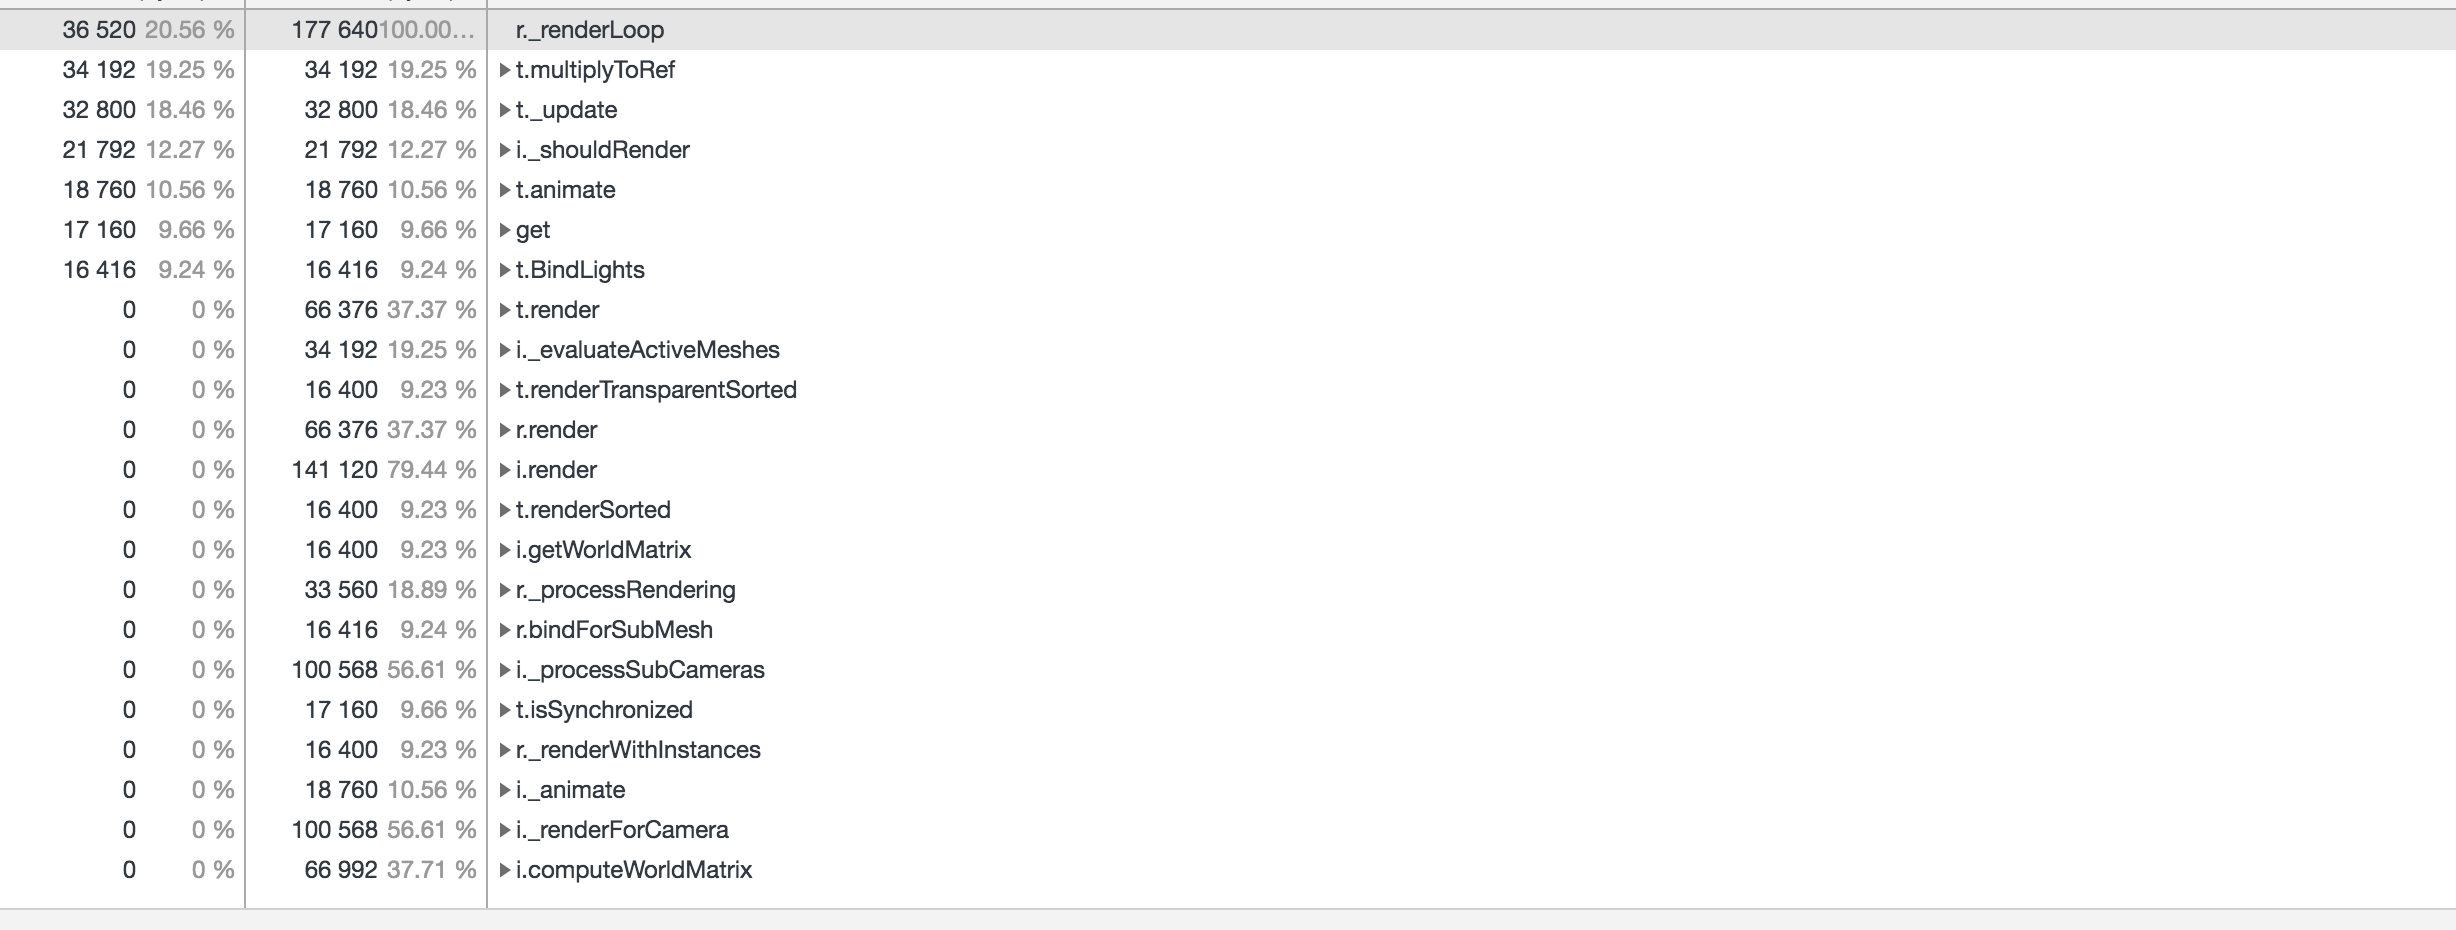
The memory leak I am seeing is on instanced meshes, specifically sourceMesh._visibleInstances – When I freezeActiveMeshes, the object constantly gets added to on every render without clearing out the previous renderIds, so it begins to grow and grow and grow (until unfreeze is called, then it clears out). – I do however unfreeze everytime a mesh is added, and or when a mesh is enabled/disabled, so even with the memory leak it seems to be faster than without the behavior.

The behavior in question is as follows: (I call this method after initializing scene).

Object.defineProperty(BABYLON.Scene.prototype, "$$initializeFreezeCallbacks", {
  value() {
    this.onNewMeshAddedObservable.add(function(mesh) {
      if(this._activeMeshesFrozen) {
        this.unfreezeActiveMeshes();
      }

      console.log('new mesh added to scene', mesh.name);

      mesh.$$onSetEnabledObservable.add(function(val){
        if(val === true && mesh._scene._activeMeshesFrozen) {
          mesh._scene.unfreezeActiveMeshes();
        }
      }, undefined, undefined, mesh);

      mesh.onDisposeObservable.add(function(val){
        if(mesh._scene._activeMeshesFrozen) {
          mesh._scene.unfreezeActiveMeshes();
          mesh._scene.$$scheduleFreeze();
        }
      }, undefined, undefined, mesh);

    }, undefined, undefined, this);

    this.onAfterRenderObservable.add(function() {
      if(this.$$freeze_scheduled || !this._activeMeshesFrozen && this._activeParticleSystems.length === 0) {
        this.freezeActiveMeshes();
        this.$$freeze_scheduled = false;
      }
    }, undefined, undefined, this);
  }
});

So the idea is, when a mesh is enabled, disabled, unfreeze once per frame, but always freeze after rendering, unless particles are flying around (I could probably do better if there is a particle.onDispose method I could tap into but haven’t dug into that yet and don’t think there is).

Initially I had a super bad memory leak (consistently drops 1 fps per second until <5fps) when I would freezeActiveMeshes, that I fixed by overwriting/commenting out the following line in renderingGroup render method (don’t think it’s related, because commenting back in doesn’t fix the underlying issue,but for what it’s worth)

        // if (renderSprites) {
        //     this._renderSprites();
        // }

So my question is, do you see anything wrong with what I am doing above. If not, do you happen to have any ideas as to what could be causing sourceMesh._visibleInstances to pile up like this?

That smells like a bug in the engine:)

Do you mind creating a simple repro in the PG? I will have a look at it as this does not seem to be your fault

Well I tried to repro with no chance:
https://www.babylonjs-playground.com/#LQ33Y2

I freeze/unfreeze every second but memory stays stable:
image

So, it looks like I’m unable to reproduce it in my non game scene (where there is basically nothing happening). Some other combination of factors seems to be causing it, though I’m not sure what at this point. I thought maybe shadow map also, already tried without it and same behavior. Hmmm

@Deltakosh any ideas where I could look based on this profile? I do see that when I freeze, activate call uses most of cpu. - In both instances I’m doing nothing while profiling, though there are a few constant animations running. Also I have a main light which I am animating intensity/color.

With the freeze behavior enabled below

Without the freeze behavior enabled

And found yet another memory leak. This one related to what I mentioned above with sprites, just hadn’t noticed it. The commenting out I was having to do is because when I freezeActiveMeshes,

scene._renderingManager.renderingGroups[0]._spriteManagers

begins to grow in length each frame. So that explains why I had to comment out _renderSprites at least. Not sure if that’s related to my original issue above but will explore.

Also worth noting once again that I’m still stuck on 3.1 alpha 6 or something around there, in case anyone recalls a bug that sounds like this one being fixed in newer versions

@Deltakosh

I think I may have figured it out, well at least, not the why but a workaround.

Regarding second memory leak, I simply removed instantiating the sprite managers since they don’t work for me anyways, I wasn’t using them to begin with, don’t know why I was instantiating them other than forgot to delete at some point.

Regarding original issue:
As per the profile, _activate was being called still, but only on instanced meshes. So I added this:

Object.defineProperty(BABYLON.InstancedMesh.prototype, "_activate", {
  value: function(renderId) {
    if(this._scene._activeMeshesFrozen) { return }
    // console.log('calling activate in instanced mesh');
    if (this._currentLOD) {
      this._currentLOD._registerInstanceForRenderId(this, renderId);
    }
  }
})

Which stopped the memory leak, since it didn’t call the _registerInstanceForRenderId, which is where it was occurring. – As far as I can tell, things seem to be functioning normally with freezeActiveMeshes again.

I could not however figure out exactly where _activate was being called, so I’m wondering if you happen to know of a better place to fix the issue, i.e. if there is more computation that can be avoided.

Hello, why are you locked behind the current version? Can we help on that?

On your question: this is weird as mesh_activate is only called from the evaluateActiveMeshes (Which should not be called anymore when frozen) and from renderTarget.Render (which is used in my demo with shadows)

My guess is that we may have fixed something in between your version and the current one (your profile tends to prove it as _activate should never be called)

I also have this problem. But when I use your code, the instance will disappear.

A repro in the playground would definitely help.

I think I can reproduce the problem. It seems that glowlayer and freezeactivemeshes cannot be used together.
https://www.babylonjs-playground.com/#8L50Q3#25


Memory has been growing.

The playground you shared is different from your screenshot and does not contain the glow layer. It is really strange it would cause a leak so I am pretty curious to see the repo :slight_smile:

Sorry, the URL address given is wrong; I have modified the sample URL address again.

looks like the glow is not created in the right scene. could you try this : var gl = new BABYLON.GlowLayer(“glow”, scene); ?

but this does not explain anything of the leak :slight_smile: We will look into it ASAP.

We found a reason, working on a fix with @Deltakosh stay tuned :slight_smile:

Fixed! will be in next nightly! thanks a lot @zhang

1 Like

Please let me know as soon as possible after the repair. Thank BABYLON technical team very much for the support .

It is live on preview :slight_smile: