The new bottleneck is here! _markSubMeshesAsMiscDirty()

Well my project to munge my old Dialog extension into an XR-Portal is progressing. I have ripped out stuff which now have no meaning, like having modal sub-panels & and an orthogonal camera for having flat dialog in front of the scene.

Also modernized:

  • ES 6
  • Re-generated fonts with TOB 6, so can use new Clone Factory now built into QI 2
  • Am using QI.mesh, so can do various animations in privileged mode, with scene level animations suspended.
  • Prepping for PBR materials.

I have now gone back to the old test scene and modified it to test changes before trying make the portal.

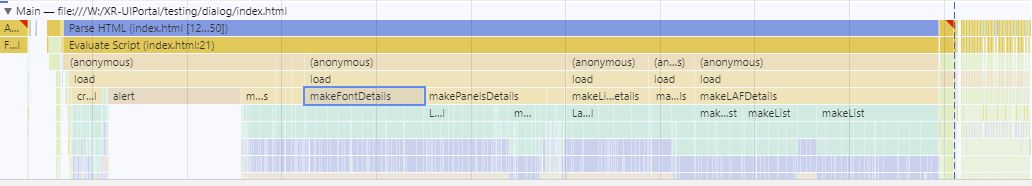
It works against the new library. This test is really overkill as far how big & complex it is, but that also makes it good for profiling. The old test page (re-)created all the geometry every time you clicked on an item button in Menu & was kind of sluggish. I changed to building all the panels in advance, & only enabling / disabling in the click.

Clicks are now all under 0.25 secs, but it now takes 7.11 seconds to initially display. It is doing 2186 clones in that time for all the letter meshes. Those clones are then merged by material / panel to bring down mesh count.

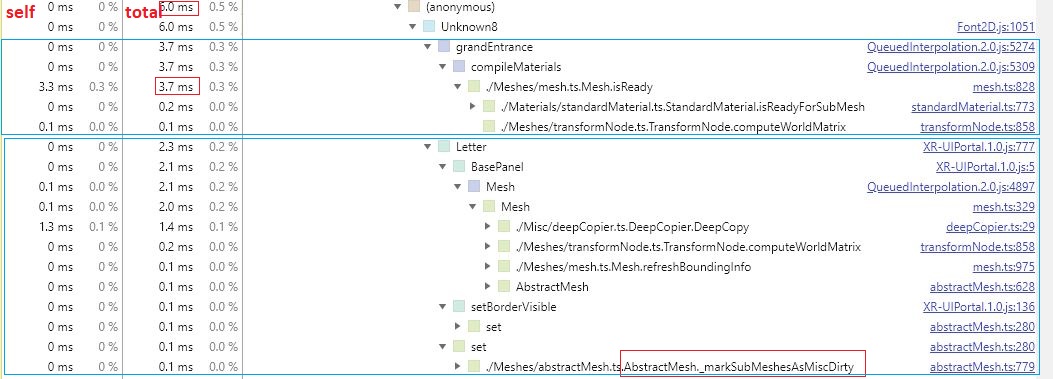
With all this processing concentrated in one place, I tried it with profiling turned on. The top item was _markSubMeshesAsMiscDirty(). This is getting called 2450 times, so avoiding calling it so often might be advised.

The CPU is all self timed, not in anything it calls. What is calling _markSubMeshesAsMiscDirty(), the cloning or the merging? What class is it even in? Usually methods named mark do not actually do much.

Well can answer the what class is it in question, by use the max file. It is in AbstractMesh.

1 Like

I see from the link to the function in the last post, that this function simply returns when this.submeshes is false. All my letters are a single material. Can you generate a mesh class without submeshes? Here is my `Font2D.A’ mesh

    class A extends XR_UIPortal.Letter {
        constructor(name, scene, resourcesRootDir, source) {
            super(name, scene, null, source, true);

            defineMaterials(scene, resourcesRootDir);
            const cloning = source && source !== null;

            this.id = this.name;
            this.isVisible  = false; //always false; evaluated again at bottom
            this.setEnabled(true);
            this.castShadows  = false;
            if (!cloning){
                this.setVerticesData(QI.B.PositionKind, new Float32Array([
                    .224,.289,0,.326,.536,0,.293,.686,0,.667,0,0,.436,.289,0,.476,.201,0,.362,.686,0,0,0,0,.186,.201,0,.1,0,0,.567,0,0
                ]),
                false);

                let _i;//indices & affected indices for shapekeys
                _i = new Uint32Array([0,1,2,3,4,5,1,3,6,6,2,1,2,7,0,0,7,8,7,9,8,8,4,0,5,10,3,3,1,4,4,8,5]);
                this.setIndices(_i);

                const positions = this.getVerticesData(QI.B.PositionKind);
                const indices   = this.getIndices();
                const normals   = new Float32Array(33);
                BABYLON.VertexData.ComputeNormals(positions, indices, normals);
                this.setVerticesData(QI.B.NormalKind, normals, false);

                this.subMeshes = [];
                new BABYLON.SubMesh(0, 0, 11, 0, 33, this);
                if (scene._selectionOctree) {
                    scene.createOrUpdateSelectionOctree();
                }
            }
            if (this.postConstruction) this.postConstruction();
            // determine if mesh should become visible right now, and if so how
            if (matLoaded && !_sceneTransitionName){
                if (typeof this.grandEntrance === "function") this.grandEntrance();
                else makeVisible(this);

            } else waitingMeshes.push(this);
        }

        dispose(doNotRecurse) {
            super.dispose(doNotRecurse);
            if (this.skeleton) this.skeleton.dispose();
            QI.CloneFactory.Clean("Font2D", "A");
        }
    }
    Font2D.A = A;

I could rip out those two lines or replace with this.submeshes = null if a default is getting created.

Well, you can actually not create submesh when there is only one material. Have a feeling one is created for you when you don’t, though. While I did not expect the number of calls to go down, the same CPU is used.

Another question I answered since last post is that this does not have anything to do with merging. There was a diagnostic switch to turn off the merging, so I used it. There now 2400 meshes, but nothing other than that changed.

It bothered me that everything was self timed when it did not look like the method did much. So I started opening up everything anyway.

This tracks to the constructors of each of the letter meshes. The reason the time is not tracked is probably they are instanced with eval in the in the clone factory. The previous system did not use eval, but time is still pretty comparable. I guess 2ms per mesh is just the overhead of creation, even if no geometry written to GPU.

1 Like

So is there still questions not answered? :slight_smile:

Correct. I am not satisfied with no self time except at the top. I never thought I had a problem from the beginning though. The average portal is going to have maybe 12 controls with an avg of 10 letters each. 120 meshes is 20 time less than 2400.

This “atom smasher”, as I call them, take a long time to set up & this one is just a 30 min conversion. Never turn down an opportunity. Converting the old pre-eval cloning system will probably take less time than writing this. Right out the gate this will answer if eval is causing the weird profile data.

If the answer is yes, then what does this show in the data? That’s 2 questions right there. Beyond that, why is this “marker” method even being called on such a short lived object?

well interesting.
One thing to consider is that you can turn off the material dirty mechanism that happens on every change by default and only call it when all your changes are done:
https://doc.babylonjs.com/how_to/optimizing_your_scene#blocking-the-dirty-mechanism

1 Like

Well, made some progress. Did try against pre-eval scene, but still no self times. Went to Chrome just “because”, and I get a much different story. Again all the time is in constructing the clones, not merging them.

With Chrome, you can select a function out of the results, here makeFontDetails which makes one of the panels, and the call tree below contains a break out of just that.

Here is a constructor for an instance of Unknown8, the ‘&’ letter, which is not a legal name for a class, so the name is changed.

First thing to notice is _makeSubMeshesAsMiscDirty is down at the bottom, and a non-issue. Firefox is fired for profiling.

Next thing is half of the time is grandEntrance(), a feature of QI.Mesh. But these meshes do not even have a material. They are just geometry stores. I changed the exporter to not even generate any code to make the mesh visible, when it has no material, and re-exported the fonts.

With that Chrome improved, using a simple wall clock duration console log, but Firefox did not. Think I am going to stop using Firefox altogether. Chrome is probably closer to Exokit, anyway.

Probably the last thing I am going to try is seeing if the deep copy is also slowing things down, in that just doing a setVerticesData() is actually quicker. I realize that this is now not really cloning, and now no GPU memory would be reduced, but I am merging everything, so that does not apply.

Just going to put a switch in QI.CloneFactory to be able to always create “fresh” meshes & see what happens over 2400 tries.

1 Like

Wow, that “fake” cloning REALLY knock the CRAP out of the time.

Edit: Even on Firefox

excellent!