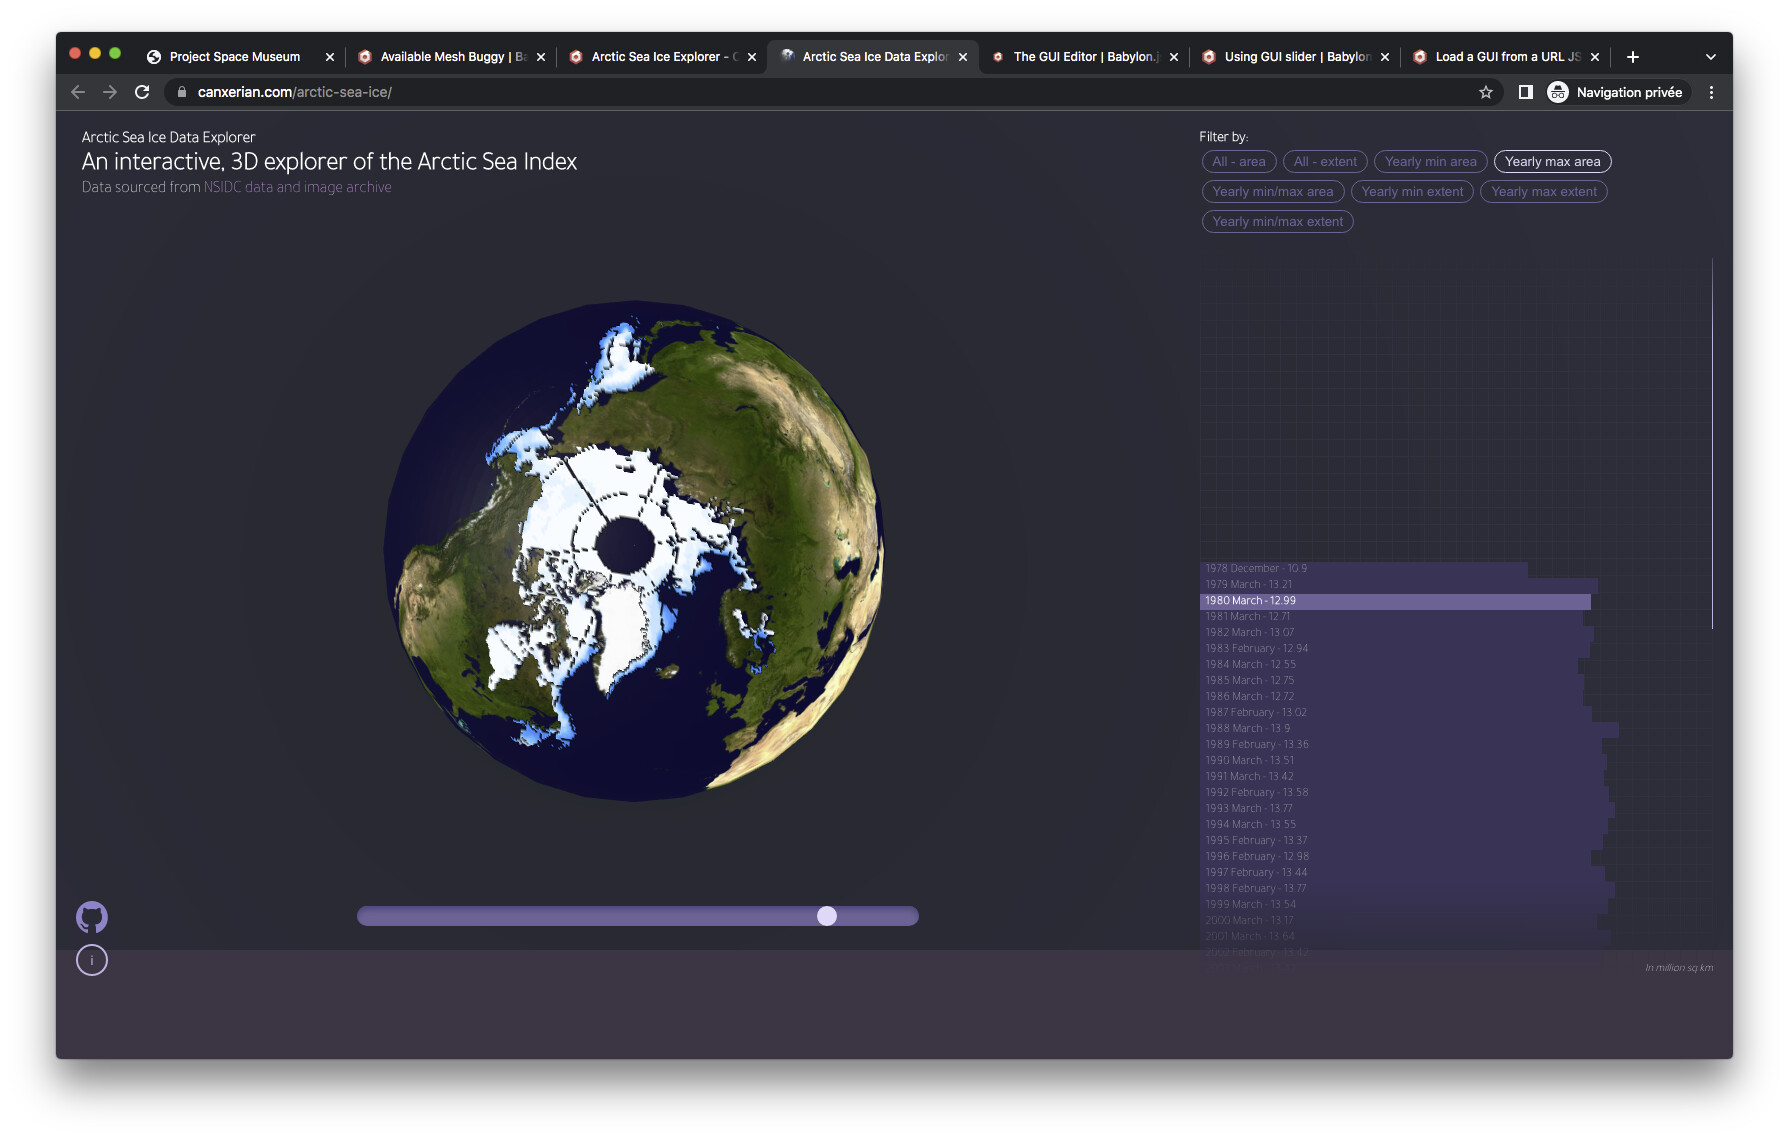
Arctic Sea Ice Explorer - Open Source!

Hey folks,

I recently created Arctic Sea Ice Data Explorer using babylon.js. Enjoy!

Source code: GitHub - canxerian/arctic-sea-ice: Arctic sea ice 3D data visualisation built with React + BabylonJS

This project was inspired by, and uses the same data as Nasa’s video: Annual Arctic Sea Ice Minimum Area 1979-2022, With Graph - YouTube

7 Likes

Really nice !!! cc @PirateJC

1 Like

@mark_nguyen are you on twitter? I’d like to tweet about this from the Babylon account.

1 Like

Sure, thanks! https://twitter.com/CodingCanxerian

1 Like

Nice job :+1: I would have one comment though. When you browse through periods the way it is, the changes aren’t obvious. You would nearly want to give credit to Donald saying climate change is a scam. At least at this scale.
Do you plan to add a compare (periods) feature? Like say march 1980 towards march 2021. Because, when you look at it like that, it suddenly becomes kind of scary :fearful:


Edit: Here’s a real scary one. Sept. 2020 towards sept. 1979


1 Like

Thank you for the very good feedback! Compare would be very useful, I shall have a think.

It’s encouraging to hear the feedback and different conclusions users have drawn from the interactive visualisation. Thanks!

1 Like