Low-Level Havok Debug Lines Visualization

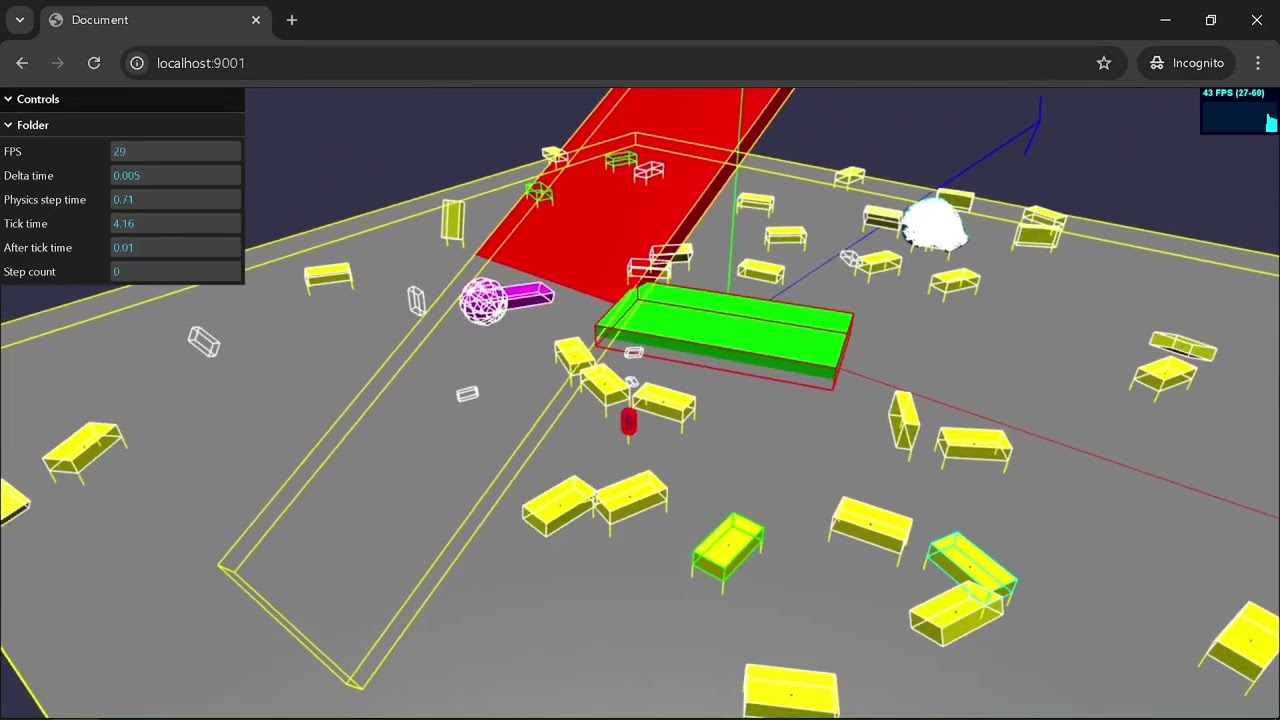
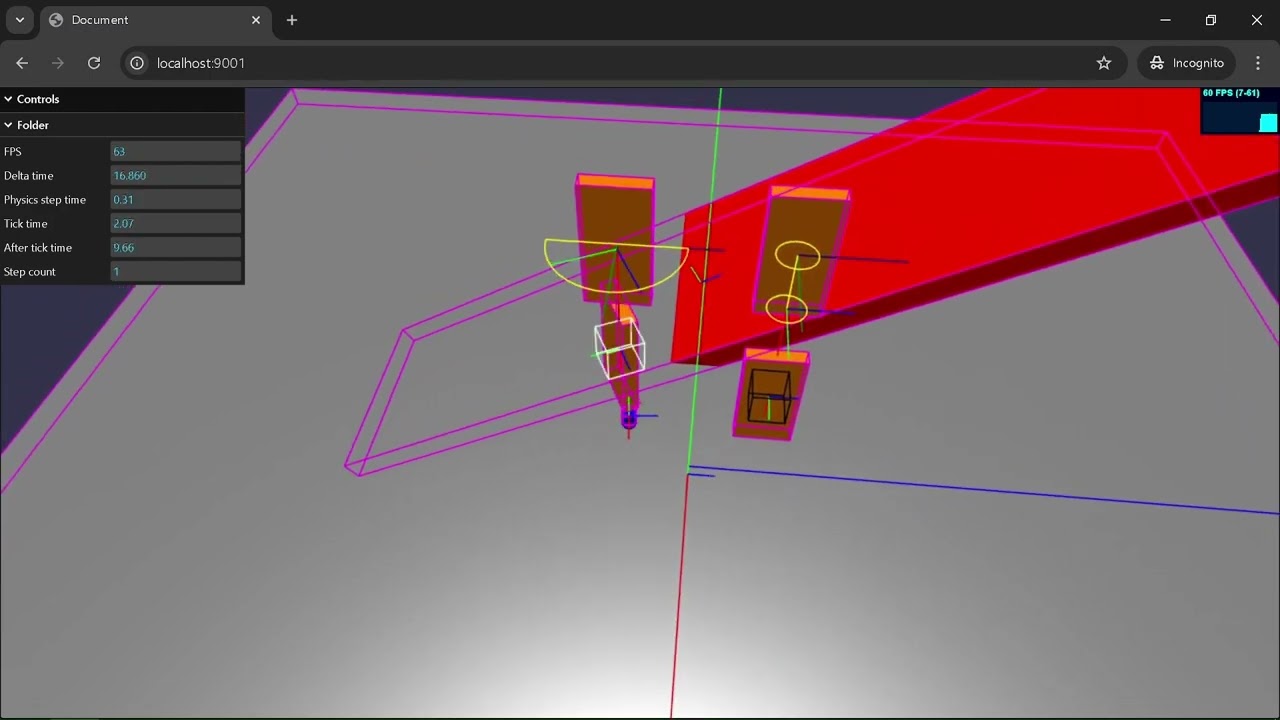
Both Ammo/Bullet and PhysX physics engines have debug drawers:

I’ve added debug drawers for both in my Babylon JS project. I was hoping to add one for Havok too.

Ammo/Bullet

PhysX

Could Havok expose a drawLine()/getLines() debug drawing function like both Ammo/Bullet and PhysX do?

Thank you for your help :slight_smile:

2 Likes

There is a physics viewer https://www.babylonjs-playground.com/#CA51CM#2
Rendering is done with Babylon using datas coming from the physics engine.
I’m not sure to understand your need actually.

1 Like

I’m curious if Havok also exposes a debug drawing interface that gives raw lines. Both Bullet and PhysX give an array of lines and colors that can be rendered with BABYLON.LineMesh. These lines not only include the shape geometry, but also axes, contact points and normals, velocity/force lines, joint axes, different colors for awake/asleep and static/kinematic/dynamic, and much more

Please see a video of my test project with Ammo’s debug drawer below:

Both Bullet and PhysX allow us to enable/disable certain aspects of the debug drawing via enums (for example, maybe you want to disable velocity/force lines):

It would be awesome if Havok’s debug drawer with the features:

  • raw lines and colors
  • enable/disable certain parts of the debug drawing

could be exposed. Thank you for considering :slight_smile:

Honestly, I think it would be great if Babylon.js had its own DebugDraw API, independent of the physics engine. Something similar to UE and Unity’s debugDrawPoint, debugDrawLine API would be awesome.

1 Like

As a reference, you can get the physicsBody geometry as a new mesh as shown in Make CONVEX_HULL visible - #6 by Raggar

const debugMeshFromBody = (body, havokPlugin, scene) => {
    const bodyInfoGeom = havokPlugin.getBodyGeometry(body)
    const { positions, indices } = bodyInfoGeom

    
    const debugMesh = new BABYLON.Mesh("custom", scene)
    indices.reverse()       
    const vertexData = new BABYLON.VertexData()
    vertexData.positions = positions
    vertexData.indices = indices	

    
    vertexData.applyToMesh(debugMesh)

    
    return debugMesh
}

Also

BABYLON.Debug.PhysicsViewer()

from earlier in the thread. It would be interesting to round out debugMeshFromBody() with easy extraction and visualization of normals, contact points, velocity, etc.

I think this is already mostly handled by BABYLON.Debug.PhysicsViewer as @Cedric and @HiGreg shared. If not, this would be awesome as a separate request, since this request is the opposite - instead looking for lower level debug drawer within Havok itself


Thank you for sharing, HiGreg. Bullet and PhysX also both provide debug geometry data like Havok. However, Bullet and PhysX additionally provide raw line and color data, which is much closer to the ground truth of what the physics engine “sees”. Also, the colors can indicate different states like awake/asleep, and the lines can be scaled up/down by the user (e.g. if a debug axis is too small).

With Havok, which currently doesn’t provide raw line and color data, I could instead use DebugGeometryInfo and then render it at the position and rotation collected from the body, however this is pretty much what we’re all already doing for the visual scene anyways, kind of defeating the purpose of debug drawing. Instead, if we had the raw line and color data, we can truly verify if our Babylon scene matches what Havok sees

I hope this can help make the difference between using (1) debug geometry vs. (2) raw lines and colors clearer:


1. Pseudocode for debug geometry approach:

for each body {
    get debug geometry

    get position and rotation of body
    /*
        Needing to collect the position and rotation from bodies kind
of defeats the purpose of debug drawing, since this is already what
we're doing for the non-debug visual scene
    */

    render debug geometry at position and rotation

    /*
        You still need to:
            - derive colors based on states (awake/asleep)
            - create additional lines for:
                - contact points and normals
                - velocity/forces
                - body axes and joint axes
                - and more...

        You could get all of these for free with the raw lines and colors
approach
    */
}

2. Pseudocode for raw lines and colors approach:

use enum to choose what to include/exclude in debug drawing

get lines and colors from Bullet/PhysX debug drawer

render lines and colors (with BABYLON.LineMesh)

/*
    There's no need to get the position and rotation of each body to
know where to render anything. Simply render the lines as they are, 
which makes this debugging method closer to Bullet/PhysX's ground truth
*/

lines and colors are simply arrays with lines and colors. There is no concept of what these lines and colors represent (e.g. body wireframe or contact normal) or belong to (e.g. which body). They are just simply 2 arrays - 1 with lines and 1 with colors that we can render directly.

My concern, generally, is with the frame-by-frame extraction and conversion of “lines and colors” to Babylon structures rather than a more efficient structure such as a one-time extraction of physicsBody geometry and setting the original mesh as parent (that way, “taking care” of world/local coordinates). Getting lines/colors could then (maybe) be made efficient by passing indexes into vertex positions, complicated by vertex indexes using .reverse() when pulled from HavokPlugin.

I’m making a whole lot of assumptions. Suffice to say that performance is my concern.

1 Like

Good point about performance. Technically, if these lines and colors were exposed by Havok, Babylon doesn’t need to use it in its BABYLON.Debug.PhysicsViewer. This is similar to how Babylon never used Ammo/Bullet’s built-in debug drawer

This feature request is for new items (e.g. collect lines function) to be exposed in the Havok JS and WASM with zero changes in Babylon JS, thus there should be no performance impact on Babylon

I see how the initial ask was not so clear, so thank you for helping me make this feature request clearer :slight_smile:

2 Likes

With Physics V2, Physics plugin provides geometry for a particular body:

Basically, it’s positions and indices.
Then, in physicsViewer, a mesh with this geometry/body association is created and updated. As shapes are static, in the sense not cloth/deformable, the mesh only needs its local to world matrix to be updated.
PhysicsViewer is generic. The plugin is reponsible for the data it provides. For example, Havok computes convex hull in its way and the debug datas are a corresponding representation.

1 Like

I can’t speak to what the PhysicsViewer provides, but I dove into Bullet3 and PhysX pages linked earlier, and compred to what is provided in the Havok plugin.

Also, I think @regna 's idea that “raw line and color information” is somehow already generated inside Havok is likely not correct (but I have no evidence for my assertion, just wondering why would it?).

If raw color/line information doesn’t exist, then it would need to be created. With that in mind, my thought is to generate babylon visualization by initializing with physics shape data, then iterating, each physics frame, over each body for activation, position, rotation, and velocities and finally iterating over collisions for the contact points, normals, and impulses (and triangle index if it can be visualized).

I note here that Havok provides shape (geometry) debug visualization, but doesn’t seem to provide direct/aggregated access to body information (is that what PhysicsViewer does?)

In the lists below of Bullet3 and PhysX, I’ve noted with "Y"es, "N"o, "M"aybe, "E"quivalent possible, and “?” (don’t know what that is).

Ignoring constaints/joints for now.

Bullet3

  • enum DebugDrawModes
  • DBG_NoDebug = 0,
  • Y DBG_DrawWireframe = 1,
  • Y DBG_DrawAabb = 2,
  • N DBG_DrawFeaturesText = 4,
  • Y DBG_DrawContactPoints = 8,
  • E DBG_NoDeactivation = 16,
  • N DBG_NoHelpText = 32,
  • N DBG_DrawText = 64,
  • N DBG_ProfileTimings = 128,
  • ? DBG_EnableSatComparison = 256,
  • ? DBG_DisableBulletLCP = 512,
  • ? DBG_EnableCCD = 1024,
  • M DBG_DrawConstraints = (1 << 11),
  • M DBG_DrawConstraintLimits = (1 << 12),
  • N DBG_FastWireframe = (1 << 13),
  • Y DBG_DrawNormals = (1 << 14),
  • N DBG_DrawFrames = (1 << 15),
  • DBG_MAX_DEBUG_DRAW_MODE
  • DefaultColors()
  • m_activeObject(1, 1, 1),
  • m_deactivatedObject(0, 1, 0),
  • m_wantsDeactivationObject(0, 1, 1),
  • m_disabledDeactivationObject(1, 0, 0),
  • m_disabledSimulationObject(1, 1, 0),
  • m_aabb(1, 0, 0),
  • m_contactPoint(1, 1, 0)

PhysX

Sleeping bodies are drawn in black, while awake bodies are drawn in white. If the body is sleeping and part of a sleeping group, it is drawn in red.

  • Y eWORLD_AXES
  • Y eBODY_AXES
  • E eBODY_MASS_AXES [CG, INERTIA]
  • Y eBODY_LIN_VELOCITY
  • Y eBODY_ANG_VELOCITY
  • Y eCONTACT_POINT
  • Y eCONTACT_NORMAL
  • ? eCONTACT_ERROR
  • Y eCONTACT_IMPULSE (eCONTACT_FORCE PX_DEPRECATED)
  • M eFRICTION_POINT
  • M eFRICTION_NORMAL
  • M eFRICTION_IMPULSE
  • ? eACTOR_AXES
  • Y eCOLLISION_AABBS (Visualize bounds (AABBs in world space)))
  • Y eCOLLISION_SHAPES
  • ? eCOLLISION_AXES
  • Y eCOLLISION_COMPOUNDS - Compound visualization (compound AABBs in world space) [CONTAINER TYPE vs. COLLISION TYPE]
  • M eCOLLISION_FNORMALS - Mesh & convex face normals
  • M eCOLLISION_EDGES - Active edges for meshes
  • M eCOLLISION_STATIC
  • M eCOLLISION_DYNAMIC
  • eJOINT_LOCAL_FRAMES [CONSTRAINTS]
  • eJOINT_LIMITS [CONSTRAINTS]
  • ? eCULL_BOX
  • ? eMBP_REGIONS
  • Y eSIMULATION_MESH
  • N eSDF

LINK TO HAVOK INTERFACE

[ONCE?]

  • HP_Body_GetGravityFactor(bodyId : HP_BodyId): [Result, number];
  • HP_Body_GetLinearDamping(bodyId : HP_BodyId): [Result, number];
  • HP_Body_GetAngularDamping(bodyId : HP_BodyId): [Result, number];

[PER FRAME?]

  • HP_Body_GetQTransform(bodyId : HP_BodyId): [Result, QTransform];
  • HP_Body_GetActivationState(bodyId: HP_BodyId): [Result, ActivationState];
  • HP_Body_GetLinearVelocity(bodyId : HP_BodyId): [Result, Vector3];
  • HP_Body_GetAngularVelocity(bodyId : HP_BodyId): [Result, Vector3];
  • HP_World_GetCollisionEvents(world : HP_WorldId): [Result, number];
  • HP_World_GetNextCollisionEvent(world: number, previousEvent: number): number;
  • HP_Event_AsCollision(eventId : number): [Result, CollisionEvent];

[CONSTRAINTS]

  • HP_Constraint_GetAxisFriction(constraint : HP_ConstraintId, axis : ConstraintAxis): [Result, number];
  • HP_Constraint_GetAxisMode(constraint : HP_ConstraintId, axis : ConstraintAxis): [Result, ConstraintAxisLimitMode];
  • HP_Constraint_GetAxisMinLimit(constraint : HP_ConstraintId, axis : ConstraintAxis): [Result, number];
  • HP_Constraint_GetAxisMaxLimit(constraint : HP_ConstraintId, axis : ConstraintAxis): [Result, number];
  • HP_Constraint_GetAxisMotorType(constraint : HP_ConstraintId, axis : ConstraintAxis): [Result, ConstraintMotorType];
  • HP_Constraint_GetAxisMotorMaxForce(constraint : HP_ConstraintId, axis : ConstraintAxis): [Result, number];
  • HP_Constraint_GetAxisMotorPositionTarget(constraint: HP_ConstraintId, axis: ConstraintAxis): [Result, number];
  • HP_Constraint_GetAxisMotorVelocityTarget(constraint: HP_ConstraintId, axis: ConstraintAxis): [Result, number];
  • HP_Constraint_GetAxisMotorStiffness(constraint: HP_ConstraintId, axis: ConstraintAxis): [Result, number];
  • HP_Constraint_GetAxisMotorDamping(constraint: HP_ConstraintId, axis: ConstraintAxis): [Result, number];
  • [Triggers not shown here]

[ITERATE ON BODIES]

  • Returns the addr of the world’s body buffer, use with HP_Body_GetWorldTransformOffset:
  • HP_World_GetBodyBuffer(world: HP_WorldId): [Result, number];
  • HP_World_GetNumBodies(world : HP_WorldId): [Result, number];
  • Return the memory offset containing the body’s transform from the world’s body buffer:
  • HP_Body_GetWorldTransformOffset( bodyId: HP_BodyId ): [Result, number];

[SCALE VISUALIZATION OF VELOCITIES]

  • HP_World_GetSpeedLimit(world: HP_WorldId): [Result, number /linear limit/, number /angular limit/];

[Existing debug - shape only, not body]

  • HP_Shape_CreateDebugDisplayGeometry( shape : HP_ShapeId ) : [Result, HP_DebugGeometryId];

  • HP_DebugGeometry_GetInfo( geometry : HP_DebugGeometryId ) : [Result, DebugGeometryInfo];

  • HP_DebugGeometry_Release( geometry : HP_DebugGeometryId ) : Result;

    export type CollisionEvent = [
        /* Type */ EventType,
        /* Contact on body A */ ContactPoint,
        /* Contact on body B */ ContactPoint,
        /* Impulse applied */ number
    ];
    
    export type ContactPoint = [
        /* Body ID */ HP_BodyId,
        /* Collider ID */ HP_ShapeId,
        /* Shape hierarchy */ ShapePathIterator,
        /* Position */ Vector3,
        /* Normal */ Vector3,
        /* Triangle index */ number
    ];
    
2 Likes

I found this Havok source from 2013, and I think this file is part of Havok’s Debug Drawer

This closely resembles Bullet’s and PhysX’s debug ability to draw points, lines, triangles, text, AABB bounding boxes, mesh geometries, and more (the most important one being lines)

/// Displays a debug point. Please use the HK_DISPLAY_POINT macro instead of calling this function directly.
void displayPoint(const hkVector4& position, hkColor::Argb color, int id, int tag);

/// Display a debug line. Please use the HK_DISPLAY_LINE macro instead of calling this function directly.
void displayLine(const hkVector4& start, const hkVector4& end, hkColor::Argb color, int id, int tag);

/// Display a debug line. Please use the HK_DISPLAY_LINE macro instead of calling this function directly.
void displayTriangle(const hkVector4& a, const hkVector4& b, const hkVector4& c, hkColor::Argb color, int id, int tag);

/// ...

/// Outputs user text to the display. (The manner in which the text is displayed depends on the
/// implementation of the display handler.)
void displayText(const char* text, hkColor::Argb color, int id, int tag);

/// Outputs user text to the display at the coordinates in world space
void display3dText(const char* text, const hkVector4& pos, hkColor::Argb color, int id, int tag);

/// ...

/// Displays the geometries for one frame in immediate mode.
void displayGeometry(const hkArrayBase<hkDisplayGeometry*>& geometries, const hkTransform& transform, hkColor::Argb color, int id, int tag);

/// Displays the geometries without transform for one frame in immediate mode.
void displayGeometry(const hkArrayBase<hkDisplayGeometry*>& geometries, hkColor::Argb color, int id, int tag);

/// Display a wireframe AABB.
/// Please use the HK_DISPLAY_BOUNDING_BOX macro instead of calling this function directly.
void displayAabb(const class hkAabb& aabb, hkColor::Argb color, int id, int tag);

/// Display a wireframe AABB with a transform.
/// Please use the HK_DISPLAY_BOUNDING_BOX macro instead of calling this function directly.
void displayAabb(const hkTransform& transform, const class hkAabb& aabb, hkColor::Argb color, int id, int tag);

Thank you for all of your patience here :slight_smile: I’ve been adding a lot of info here

In summary, through my experience with Bullet and PhysX (and I believe the same holds true for Havok):

Debug lines and colors offer the following advantages over just geometries:

  1. With only geometries, you are missing lines for axes, contact normals, velocities/forces, and more
  2. With only geometries, you are missing colors that can change depending on states (e.g. awake/asleep, contacting, static/kinematic/dynamic)
  3. With only geometries, if you render your actual mesh and the debug geometry at the same position and rotation, this almost defeats the purpose of debug drawing. Instead, if you render a list of debug lines, you can truly verify if your actual mesh is where the physics engine “sees” it

Some questions:

What is “debug” in “debug lines”? The documentation of Havok and Bullet3 seem to offer just “drawLines” and similar for points, spheres, etc. There doesn’t seem to be an automatic connection to body states or characteristics.

Does “debug” refer to the temporary nature of a line? Or does it refer specifically to state information from physicsBody being drawn with drawLine()? Does drawLine just draw a line using WebGL on a canvas without retaining any object permanence within the framework (e.g. BABYLON)? Perhaps that is what “immediate mode” means? If so, does this mean there is an expectation that every debug drawLine() needs to be repeated at least every visual rendered frame? How do physicsBody debug representations change (i.e. update, not update, overwrite, or duplicate) if there are multiple physics frames per visual render frame?

If drawLine() is an an “immediate mode” drawing with no object permanence, then would BABYLON-supplied “immediate mode drawing” primitives be useful? Maybe that’s what you’ve been saying all along and I’m just now catching up.

1 Like

Bullet’s drawLine() actually doesn’t draw a line. Perhaps a better name for it would be getLine() :slight_smile: In the link, you’ll see that .drawLine is a property callback that’s fired for each line. You can access the from and to positions in the callback and store all these lines in an array to render with Babylon

PhysX’s getLines() is more straightforward. It just gives an array of lines we can render with Babylon

As shown in the original post, the Bullet and PhysX debug drawings are different and opinionated. I would love to see how Havok’s built-in, opinionated debug drawings look like


This is why I think lines are so great :slight_smile: Once a line (and color) is added to the array of lines (and colors), there is no concept of what the line represents (e.g. axes, body wireframe) or belongs to (e.g. which body). We just simply render the lines and colors and see if it matches up with our actual scene


Also, thank you, @HiGreg, for taking the time to document the parity between the Bullet and PhysX enums with the currently available Havok TS API. That must have taken a lot of time to go through, and I really appreciate it

You’re welcome! I’m also interested in debugging physics as well. I still haven’t looked into PhysicsViewer or HP_Shape_CreateDebugDisplayGeometry.

I wanted to see if what I was suggesting was at all valid, so I wrote up some functions to

  • Reduce (original) mesh alpha
  • Generate debug shape as mesh
  • Set debug mesh to wireframe
  • Update debug mesh each frame for position, quaternion, and ActivationState

I’m sure this isn’t the most efficient, but it demonstrates my concept. There’s an error somewhere in my code (or, less likely, in Havok) where the activation state often stays active even when the body appears to come to a stop.

var debugMeshes = null;
const ActivationStateColors = [BABYLON.Color3.Green(),BABYLON.Color3.Red()]

// call bodyInfo and all bodies in havok will show as wireframe 
// colored according to ActivationState (green=active; red=inactive)
// this adds an onBeforeRender observer
function bodyInfo() {
    if(debugMeshes) {
        debugMeshes.forEach((m)=>m.dispose())
        debugMeshes = null;
    }
    // set up debug mesh Map
    debugMeshes = new Map(hk._bodies.entries().map((e)=>{
        const b = e[1].body;
        const m = b.transformNode;
        const debugMesh=debugMeshFromBody(b, hk, scene)
        debugMesh.material = new BABYLON.StandardMaterial("debug");
        debugMesh.material.wireframe=true;
        debugMesh.material.diffuseColor = BABYLON.Color3.White()
        debugMesh.position.copyFrom(m.position)
        debugMesh.rotationQuaternion=m.rotationQuaternion.clone()
        m.material.alpha = 0.2//isVisible = false
        return [e[0],debugMesh]
    }))

    scene.onBeforeRenderObservable.add(perFrame)
}

function perFrame() {
    hk._bodies.entries().forEach((e)=>{
        const b = e[1].body;
        const m = b.transformNode;
        //console.log("frame",e[0])
        const dm = debugMeshes.get(e[0])
        if (!dm) return
        dm.position.copyFrom(m.position)
        dm.rotationQuaternion.copyFrom(m.rotationQuaternion)
        const astate = hk._hknp.HP_Body_GetActivationState([e[0]])[1].value
        dm.material.diffuseColor.copyFrom(ActivationStateColors[astate])
    })

// https://playground.babylonjs.com/#Z8HTUN#372

const debugMeshFromBody = (body, havokPlugin, scene) => {
    const bodyInfoGeom = havokPlugin.getBodyGeometry(body)
    const { positions, indices } = bodyInfoGeom
    const debugMesh = new BABYLON.Mesh("custom", scene)
    indices.reverse()       

    const vertexData = new BABYLON.VertexData()
    vertexData.positions = positions
    vertexData.indices = indices	
    vertexData.applyToMesh(debugMesh)

    return debugMesh
}
1 Like

And here’s code that shows a temporary growing sphere at each collision point.

var contactSpheres = Array();

// sphere starting size; adjust to the scale of your scene
// scaling multiplier per frame
// ending scale; use pow() to specify in frames
const size_StartIncStop = [0.01,1.1,Math.pow(1.1,25)] // adjust to the scale of your scene

function showCollisions() {
    const observer = hk.onCollisionObservable.add((collisionEvent) => {            
        if (collisionEvent.type=="COLLISION_STARTED") {
            const cm = BABYLON.MeshBuilder.CreateSphere("c", { diameter: size_StartIncStop[0], segments:16,updatable: true, wrap: true}, scene);
            cm.position.copyFrom(collisionEvent.point)                
            contactSpheres.push(cm);
        }
    })
}

Per frame:

scene.onBeforeRenderObservable.add(()=>{
    contactSpheres.forEach((m)=>m.scaling.scaleInPlace(size_StartIncStop[1]))
    if (contactSpheres.length>0 && contactSpheres[0].scaling.x>size_StartIncStop[2])
        contactSpheres.shift().dispose()
})
1 Like

Now I’ve hooked into collisions and created a structure to provide persistent contact points with thinInstances on a reference mesh (small sphere, white dots). I also create impulse lines proportional to the impulse.

Most of these objects (representing dice) are not moving but it takes a while for havok to mark them inactive (the bottom center object is inactive, shown as red). Frequently, havok never marks them inactive and occasionally the objects will jiggle around usually after a small extra impulse. This is possibly due to an occasional skipped frame causing deltaTime to double.

Note the upper left object is touching the wall, so has impulse lines from there. The impulse lines are yellow “COLLISION_CONTINUE” lines. COLLISION_START impulse lines are red, which flicker around the scene when the dice are bouncing around.

2 Likes

Thank you for sharing all of these, @HiGreg! As you’ve shown, for Havok, we have to gather the data (e.g. contact normals) for debug visualization ourselves. In contrast, we would get these lines for free in Bullet and PhysX, since we have access to their native debug drawers.

Below is a video of PhysX’s native joint debug lines visualization. It shows linear and angular limits (yellow curves) and joint axes, which have been super helpful for me learning how to use joints. Currently, I’m working “blind” in Havok, since we don’t have access to Havok’s native debug visualization for joints

Really cool. “For free” would be great! But of course SOMEONE has to write it.

The code I’m writing will hopefully become someone else’s “free.” I’m not fluent in typescript or JavaScript classes so maybe someone else can take this code or the ideas and implement a full-on class (or guide me to do so).

I’ve hooked into the low-level Havok body QTransform. But haven’t had luck with HP_World_GetCollisionEvents(world : HP_WorldId): [Result, number];

Instead, I’m using BABYLON’s collision event, which is a small wrapper around HP_World_GetCollisionEvents.

The hard part is implementing BABYLON structures to visualize the data efficiently. Currently using an Array() and push() shift() cloned points (Vector3). Each frame creating hundreds of thin instances.

For the lines, re-creating LineSystems each frame.

It’s super quick, and there’s a possibility to manage the data more efficiently with ArrayBuffer(). But that hasn’t been necessary yet.

1 Like