should not be possible. Do you have a repro so that we can have a look?
@Evgeni_Popov I don’t have a repro unfortunately. But here are 2 things that could be useful:
-
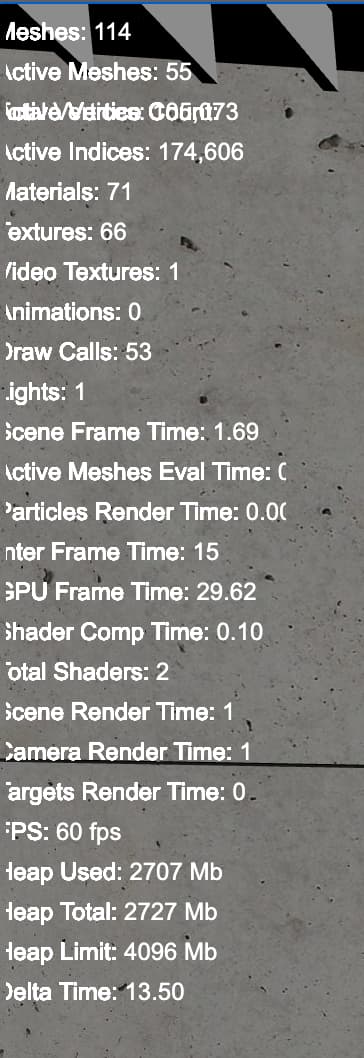
See screnshot of GPU Frame Time at ~30 ms while FPS still at 60 . I’m using a Macbook Pro
-
I’m using the below code I found on the forum to show the info:
import {
  SceneInstrumentation,
  EngineInstrumentation,
  KeyboardEventTypes as KbTypes
} from "@babylonjs/core"

import {
  TextBlock,
  StackPanel,
  AdvancedDynamicTexture,
  Button,
} from "@babylonjs/gui";

/**
 * Pressing the letter "G" on the keyboard will
 * toggle the debug panel ON/OFF
 * @param {} scene
 */
const initializeDebugPanel = (scene) => {
  // Instrumentation debugging tool
  let sceneInstrumentation = new SceneInstrumentation(scene);
  sceneInstrumentation.captureActiveMeshesEvaluationTime = true;
  sceneInstrumentation.captureFrameTime = true;
  sceneInstrumentation.captureParticlesRenderTime = true;
  sceneInstrumentation.captureRenderTime = true;
  sceneInstrumentation.captureCameraRenderTime = true;
  sceneInstrumentation.captureRenderTargetsRenderTime = true;
  sceneInstrumentation.captureInterFrameTime = true;

  const engine = scene.getEngine();
  let engineInstrumentation = new EngineInstrumentation(engine);
  engineInstrumentation.captureGPUFrameTime = true;
  engineInstrumentation.captureShaderCompilationTime = true;
  function videoTextureCount() {
    let videoTextureCounter = 0;
    for (let i = 0; i < scene.textures.length; i++) {
      if (scene.textures[i].video) {
        videoTextureCounter++;
        // console.log(scene.textures[i])
      }
    }
    return videoTextureCounter;
  }

  function addPanel(adt, ha, va) {
    const panel = new StackPanel();
    panel.horizontalAlignment = ha;
    panel.verticalAlignment = va;
    panel.height = "100%";
    panel.width = "300px";
    panel.paddingTop = "10px";
    panel.paddingLeft = "10px";
    panel.paddingBottom = "10px";
    panel.paddingRight = "10px";
    adt.addControl(panel);
    return panel;
  }

  function addInstrumentationTextBlock(panel, text) {
    const textBlock = new TextBlock();
    textBlock.text = text;
    textBlock.height = '40px';
    textBlock.width = '300px';
    textBlock.color = 'white';
    textBlock.fontSize = 24;
    textBlock.textHorizontalAlignment = 0;
    panel.addControl(textBlock);

    return textBlock;
  }

  // GUI
  const advancedTexture = AdvancedDynamicTexture.CreateFullscreenUI("UI");

  const panel = addPanel(advancedTexture, 0, 0);

  const meshesLength = addInstrumentationTextBlock(panel, 'Meshes: ');
  const activeMeshesLength = addInstrumentationTextBlock(panel, 'Active Meshes: ');
  const activeVertices = addInstrumentationTextBlock(panel, 'Active Vertice Count: ');
  const activeIndices = addInstrumentationTextBlock(panel, 'Active Indices: ');
  const materialsLength = addInstrumentationTextBlock(panel, 'Materials: ');
  const texturesLength = addInstrumentationTextBlock(panel, 'Textures: ');
  const videoTexturesLength = addInstrumentationTextBlock(panel, 'Video Textures: ');
  const animationLength = addInstrumentationTextBlock(panel, 'Animations: ');
  const drawCalls = addInstrumentationTextBlock(panel, 'Draw Calls: ');
  const totalLights = addInstrumentationTextBlock(panel, 'Lights: ');
  const frameTimeMax = addInstrumentationTextBlock(panel, 'Scene Frame Time: ');
  const evalTimeMax = addInstrumentationTextBlock(panel, 'Active Meshes Eval Time: ');
  const particlesFrameTime = addInstrumentationTextBlock(panel, 'Particles Render Time: ');
  const interFrameTime = addInstrumentationTextBlock(panel, 'Inter Frame Time: ');
  const gpuFrameTime = addInstrumentationTextBlock(panel, 'GPU Frame Time: ');
  const shaderCompTime = addInstrumentationTextBlock(panel, 'Shader Comp Time: ');
  const shaderTotal = addInstrumentationTextBlock(panel, 'Total Shaders: ');
  const sceneRenderTime = addInstrumentationTextBlock(panel, 'Scene Render Time: ');
  const cameraRenderTime = addInstrumentationTextBlock(panel, 'Camera Render Time: ');
  const targetsRenderTime = addInstrumentationTextBlock(panel, 'Targets Render Time: ');
  const fpsValue = addInstrumentationTextBlock(panel, 'FPS: ');
  const heapSize = addInstrumentationTextBlock(panel, 'Heap Used: ');
  const heapTotal = addInstrumentationTextBlock(panel, 'Heap Total: ');
  const heapLimit = addInstrumentationTextBlock(panel, 'Heap Limit: ');
  const deltaTimeValue = addInstrumentationTextBlock(panel, 'Delta Time: ');

  const cameraPanel = new StackPanel();
  cameraPanel.horizontalAlignment = 0;
  cameraPanel.verticalAlignment = 1;
  cameraPanel.height = "80px";
  cameraPanel.width = "300px";
  cameraPanel.isVertical = true;
  cameraPanel.paddingBottom = "10px";
  cameraPanel.paddingLeft = "10px";
  advancedTexture.addControl(cameraPanel);

  const clickToCopy = new TextBlock();
  clickToCopy.text = "CAMERA POSITION \n click to copy ";
  clickToCopy.height = "30px";
  clickToCopy.width = "200px";
  clickToCopy.color = "SpringGreen";
  clickToCopy.fontSize = 10;
  clickToCopy.horizontalAlignment = 0;
  clickToCopy.verticalAlignment = 1;
  clickToCopy.bottom = "40px";
  cameraPanel.addControl(clickToCopy);

  const copyButton = Button.CreateSimpleButton("copyButton", "Camera Position:");
  copyButton.width = "200px";
  copyButton.height = "30px";
  copyButton.color = "SpringGreen";
  copyButton.fontSize = "16px"
  copyButton.horizontalAlignment = 0;
  copyButton.verticalAlignment = 1;
  cameraPanel.addControl(copyButton);

  copyButton.onPointerUpObservable.add(function () {
    let camera = scene.activeCamera;
    navigator.clipboard.writeText(camera.position.x.toFixed(2) + ", " + camera.position.y.toFixed(2) + ", " + camera.position.z.toFixed(2));
  })

  scene.registerAfterRender(() => {
    meshesLength.text = "Meshes: " + scene.meshes.length;
    activeMeshesLength.text = "Active Meshes: " + scene.getActiveMeshes().length;
    activeVertices.text = `Total Vertices: ${scene.totalVerticesPerfCounter.current.toLocaleString()}`;
    activeIndices.text = `Active Indices: ${scene.totalActiveIndicesPerfCounter.current.toLocaleString()}`;
    materialsLength.text = "Materials: " + scene.materials.length;
    texturesLength.text = "Textures: " + scene.textures.length;
    videoTexturesLength.text = "Video Textures: " + videoTextureCount();
    animationLength.text = "Animations: " + scene.animatables.length;
    drawCalls.text = "Draw Calls: " + sceneInstrumentation.drawCallsCounter.current;
    totalLights.text = "Lights: " + scene.lights.length;
    frameTimeMax.text = "Scene Frame Time: " + sceneInstrumentation.frameTimeCounter.lastSecAverage.toFixed(2);
    evalTimeMax.text = "Active Meshes Eval Time: " + sceneInstrumentation.activeMeshesEvaluationTimeCounter.lastSecAverage.toFixed(2);
    particlesFrameTime.text = "Particles Render Time: " + sceneInstrumentation.particlesRenderTimeCounter.current.toFixed(2);
    interFrameTime.text = "Inter Frame Time: " + sceneInstrumentation.interFrameTimeCounter.lastSecAverage.toFixed();
    gpuFrameTime.text = "GPU Frame Time: " + (engineInstrumentation.gpuFrameTimeCounter.average * 0.000001).toFixed(2);
    shaderCompTime.text = "Shader Comp Time: " + engineInstrumentation.shaderCompilationTimeCounter.current.toFixed(2);
    shaderTotal.text = "Total Shaders: " + engineInstrumentation.shaderCompilationTimeCounter.count;
    sceneRenderTime.text = "Scene Render Time: " + sceneInstrumentation.renderTimeCounter.current.toFixed();
    cameraRenderTime.text = "Camera Render Time: " + sceneInstrumentation.cameraRenderTimeCounter.current.toFixed();
    targetsRenderTime.text = "Targets Render Time: " + sceneInstrumentation.renderTargetsRenderTimeCounter.current.toFixed();
    fpsValue.text = "FPS: " + engine.getFps().toFixed() + " fps";
    heapSize.text = "Heap Used: " + (!performance.memory ? "unavailabe" : ((performance.memory.usedJSHeapSize / 1024) / 1024).toFixed() + " Mb");
    heapTotal.text = "Heap Total: " + (!performance.memory ? "unavailabe" : ((performance.memory.totalJSHeapSize / 1024) / 1024).toFixed() + " Mb");
    heapLimit.text = "Heap Limit: " + (!performance.memory ? "unavailabe" : ((performance.memory.jsHeapSizeLimit / 1024) / 1024).toFixed() + " Mb");
    if (scene.deltaTime) {
      deltaTimeValue.text = "Delta Time: " + scene.deltaTime.toFixed(2);
    }
    if (scene.activeCamera.alpha) {
      copyButton.children[0].text = scene.activeCamera.alpha.toFixed(2) + ", " + scene.activeCamera.beta.toFixed(2) + ", " + scene.activeCamera.radius.toFixed(2);
      clickToCopy.text = "CAMERA POSITION \n Click to copy alpha, beta, radius";
    }
    else {
      copyButton.children[0].text = scene.activeCamera.position.x.toFixed(2) + ", " + scene.activeCamera.position.y.toFixed(2) + ", " + scene.activeCamera.position.z.toFixed(2);
      clickToCopy.text = "CAMERA POSITION \n Click to copy x, y, z";
    }
  })

  return advancedTexture;
}

export const createDebugPanel = (scene) => {
  let gKeyCounter = 0;

  const showDebugPanel = (advancedTexture) => {
    advancedTexture.getChildren().forEach(c => {
      console.log("Showing Debug Panel")
      c.isVisible = true;
    })
  }

  const hideDebugPanel = (advancedTexture) => {
    advancedTexture.getChildren().forEach(c => {
      c.isVisible = false;
    })
  }

  document.addEventListener('keydown', (event) => {
    const keyName = event.key;
    if (keyName === 'G') {
      gKeyCounter++
      if (gKeyCounter === 1) {
        scene.__debugPanelAdvancedTexture = initializeDebugPanel(scene);
        return;
      }
      if (gKeyCounter % 2 === 1 && scene.__debugPanelAdvancedTexture) {
        showDebugPanel(scene.__debugPanelAdvancedTexture);
      }
      else {
        scene.__debugPanelAdvancedTexture && hideDebugPanel(scene.__debugPanelAdvancedTexture);
      }
    }
  })
}
Do you have any pointers on what could be a good way to investigate the discrepancy?