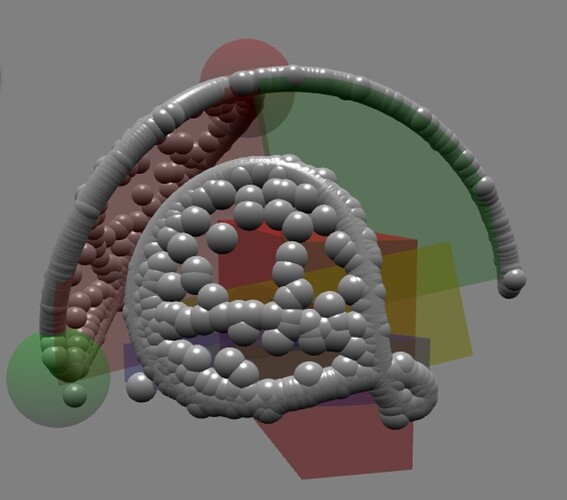
I still can’t get it quite right. Here are visualizations of the points that trace each of the balls on the child box’s physics axes, clearly showing the effects of limits.
Ignore that green and blue are locked on the opposite side. I’ll explore that later (it looks like a physics glitch).
Here, only X is locked with Y and Z limited. Green (Y) is shown appropriately as a narrow shape, but I can’t really explain the red and blue.
Red (X) should be shaped by Y and Z limits, while Blue (Z) should be shaped by X and Y limits. The transparent shape of red is close but not the rounded symmetrical shape of the trace. The blue has that tail representative of one of the limits crossing beyond +/- 90 degrees.
X Axis (red) showing Y and Z limits
Y Axis (green) showing X locked and Z limit
Z Axis (blue) showing X locked and Y limit
I should note that this example can only be obtained with 6DOF. It is not achievable from any of the named constraints as it has angular limits on two axes. See this post for the full list of possible vs. named constraints.
You can also see the “soft” limits at work in the form of trace dots occasionally showing positions slightly outside the limited areas. I think the soft limits also resulted in the physics “flipping to the opposite side,” as mentioned in the second paragraph. I speculate that this is an indication of how limits are implemented (e.g. clamped within periodic repitition of angles) within the physics engine.
Anyone want to try to explain the result with a particular eye towards visualizing the limits?


